
RUSSIAN JOURNAL OF EARTH SCIENCES, VOL. 14, ES1001, doi:10.2205/2014ES000535, 2014
A. F. Grachev1, S. E. Borisovsky2, T. F. Zinger3
1Schmidt Joint Institute of Physics of the Earth, Russian Academy of Sciences, Moscow, Russia
2Institute of the Geology of Ore Deposits, Petrography, Mineralogy, and Geochemistry (IGEM), Russian Academy of Sciences, Moscow, Russia
3Institute of Precambrian Geology and Geochronology, Russian Academy of Sciences, St. Petersburg, Russia
.The morphology and concentrations of trace elements and rare earth elements (REE) of zircon from a transitional layer of bentonite ash at the Paleocene–Eocene boundary at a locality north of Salzburg in the Eastern Alps suggest a magmatic genesis of the zircon, and data on the REE distribution in the mineral testify to an oceanic nature of the magmas. A more reliable criterion of the nature of the magmatic source is data on the Li concentrations; the latter in some of the zircon grains are much lower than the minimum values typical of the continental crust. It is hypothesized that a zircon type exists that is related to plume magmatism.
Data on the mineralogy and geochemistry of transitional layers produced during the critical epochs in the Phanerozoic that were related to mantle plumes and the mass extinction of the biota is of paramount importance for a broad circle of scientists. One of such events, which is referred to as the Paleocene–Eocene thermal maximum (PETM) was related to the activity of the Iceland plume at 55 Ma, which resulted in the ejection of 1200 km$^3$ of ash material of predominantly basalt and trachyte composition into the atmosphere, with this ash preserved in several stratigraphic units at the Paleocene–Eocene boundary in West Europe [Egger and Bruckl, 2006; Egger et al., 2005; Larsen et al., 2003]. As a result, the temperature of the oceanic water rapidly increased to 8° C, and this led to the passage of approximately $2000 \times 10^9$ tons of methane to the atmosphere and the extinction of close to 50% of benthic foraminifers [Kennet and Stott, 1991; Zachos et al., 2005].
Volcanic events analogous to those related to the Iceland plume were multiply repeated during the Earth's history and resulted in transitional layers or beds at critical boundaries (Cambrian explosion, Ordovician–Silurian, Permian–Triassic, Cretaceous–Paleogene), with these beds and layers containing bentonite clay that replaced the ash [Christidis and Huff, 2009; Clayton et al., 1996; Compston et al., 1992, and others]. The chemical composition of ashes of various age and their sedimentation and redeposition conditions are known well enough, whereas data on the geochemistry of their heavy-fraction minerals, first of all, zircon are absent, except only for the U and Th concentrations, which usually reported when the zircons are dated by the U-Pb method.
This publication reports our recently obtained data on zircon from bed X$_1$ of bentonite ash at the Paleocene–Eocene boundary in the bottom portion of the Anthering Formation exposed north of Salzburg, Austria. The formation contains 22 bentonite beds $<1.5$ cm thick, including bed X$_1$, whose thickness is 3 cm [Huber et al., 2003]. The bentonites contain similar SiO$_2$, Al$_2$O$_3$, and MgO concentrations but remarkably different TiO$_2$ ones. In contrast to the other beds, bed X$_1$ is of trachyte composition and is poor in TiO$_2$ and P$_2$O$_5$ but relatively rich in Zr, Nb, Hf, Ta, Th, and light rare earth elements (LREE) [Huber et al., 2003].
The contents of clasyogenic minerals contained in bed X$_1$ are low, and the predominant grain sizes of these minerals range from 0.05 to 0.10 mm. The minerals were separated from their host rocks using a sample treatment procedure that was adjusted for the purposes of this research.
The key feature of this procedure was the selective fractionation of the material of the sample in water and gathering the clay fraction after certain time intervals until the water suspension became clear. This was done to accurately enough segregate the clay ($<5 \:\mu$m) and grain ($>5 \:\mu$m) size fractions of the sample without significant losses of the latter.
The clay constituent of the sample was differentiated into a number of size classes via the successive separation of discrete portions of the suspension at certain time intervals, and each of these fractions was then further separated in water into two density fractions: the heavy fraction consisted of minerals whose density was grater than 3 g cm$^{-3}$, and the light one of minerals $<3$ g cm$^{-3}$ in density.
The grainy constituent usually consisted of minerals of various density and, hence, required further separation in heavy liquids. For this purpose we used bromoform (2.89 g cm$^{-3}$) and obtained two fractions: heavy ($>2.89$ g cm$^{-3}$) and light ($<2.89$ g cm$^{-3}$). An ultraheavy fraction of ore minerals was separated from the heavy one in bromoform. These minerals were the most interesting in the context of our research. The fractions were then examined under an optical microscope, and 62 zircon grains were hand-picked from these fractions for our further studies.
|
| Table 1 |
Zircon grains were analyzed at the Laboratory for the Analysis of Mineral Materials at the Institute of the Geology of Ore Deposits, Petrography, Mineralogy, and Geochemistry (IGEM), Russian Academy of Sciences, on an Leol JXA-8200 electron microprobe equipped with five wave-dispersive and one energy-dispersive spectrometers, at a beam current of 300 nA and beam diameter of 3 $\mu$m. Table 1 reports the analyzed elements, their analytical lines, analyzer crystals, differential (dif) or integral (int) modes of counter operation, exposure times, standards, and detection limits. Phosphorus was analyzed with regard for overlap of the ZrLa and PKa lines. The corrections were calculated with the ZAF routine, using the respective Jeol software.
The contents trace elements in zircon were determined by secondary ion mass spectrometry (SIMS) using a Cameca IMS-4f ion microprobe at the Yaroslavl branch of Institute of Physics and Technology, Russian Academy of Sciences.
Our samples were prepared for analysis in the form of cylindrical epoxy pellets with zircon grains. In the polished surfaces of the pellets, the polished sections of all of the grains were coplanar. The working surface of the pellets was sputter coated with an Au film 0.03 $\mu$m thick on a magnetron deposition setup.
The basics of the measurement technique corresponded to those reported in [Fedotova et al., 2008; Nosova et al., 2002; Smirnov et al., 1995]. Primary O$_2^-$ ions were accelerated to about 14.5 keV and focussed at the sample surface to a 30 $\mu$m spot. The ion current was 4.5 nA. Positive secondary ions were collected from an area 25 $\mu$m in diameter, limited by a field aperture. Molecular and ion clusters were energy filtered using an offset voltage of $ - 100$ V, with an energy window of 50 eV. Five counting cycles were carried out with a discrete transition between mass peaks within a given set. The counting time was varied depending on signal intensity and was determined automatically by statistical control. The maximum counting time for any species in each cycle was 30 s.
The absolute concentrations of each element were calculated from the measured intensities of positive single-atom secondary ions, which were normalized to the intensity of secondary $^{30}$Si$^+$ ions, using the relative sensitivity factors ${\rm C}_i={\rm I}_i/{\rm I}^{30}{\rm Si}\times {\rm K}_i$. Calibration curves were based on the measurements of the set of well characterized standard samples [Jochum et al., 2000]. The signals of $^{153}$Eu$^{+}$, $^{174}$Yb$^{+}$, $^{158}$Gd$^{+}$, and $^{167}$Er$^{+}$ were corrected to the interfering oxides of Ba and lighter REE in accordance to the scheme reported by Bottazzi et al. [1994]. The intensity of $^{174}$Hf$^{+}$ calculated from measured $^{178}$Hf$^{+}$, using value of 170.5 known for $^{178}$Hf$^{+}/^{174}{\rm Hf}^+$ ratio of hafnium natural isotopes, was also subtracted from $^{174}$Yb$^{+}$. Additional stripping procedure was used to correct the signals of $^{138}$Ba$^{+}$, $^{139}$La$^{+}$, $^{140}$Ce$^{+}$, $^{141}$Pr$^{+}$, for interfering isobaric ions ZrSiO$^{+}$ specific to zircon [Hinton and Upton, 1991]. Besides, intensities of $^{88}$Sr$^{+}$ and $^{89}$Y$^{+}$ were stripped from the interfering doubly charged hafnium ions $^{176}$Hf$^{++}$ and $^{178}$Hf$^{++}$. The ratio of singly ($^{177}$Hf$^{+}$) to doubly ($^{177}$Hf$^{++}$) charged hafnium positive secondary ions determined experimentally was 581.
The intensity of $^{92}$Zr$^{1}$H$^{+}$ secondary ions was determined via measuring the intensity of $^{94}$Zr$^{1}$H$^{+}$ at 95 a.m.u. and known ratio $^{92}$Zr/$^{94}$Zr$ = 0.9868$ of natural abundances of these zirconium isotopes and then subtracted from the measured intensity of mass peak at 93 a.m.u. to get the signal of $^{93}$Nb$^{+}$:
\begin{eqnarray*} {\rm I} \, (95 {\rm \:a.m.u}) = \:^{94}{\rm Zr}^1{\rm H}^+ \end{eqnarray*} \begin{eqnarray*} ^{92}{\rm Zr}^1{\rm H}^+ =\:^{94}{\rm Zr}^1{\rm H}^+ \times 0.9868 \end{eqnarray*} \begin{eqnarray*} ^{93}{\rm Nb}^+ = {\rm I}\,(93 \:{\rm a.m.u.}) - \:^{92}{\rm Zr}^1{\rm H}^+ \end{eqnarray*}Detection limit of niobium in zircon nevertheless limited by the value $\sim 10$ wt ppm because of high intensity of neighboring $^{92}$Zr$^{+}$.
The phosphorous content was estimated using stripping procedure. The contribution of $^{30}$Si$^{1}$H$^{+}$ to the measured intensity of mass peak at 31 a.m.u. was determined from intensity $^{29}$Si$^{+}$ and known abundances of natural silicon isotopes:
\begin{eqnarray*} ^{28}{\rm Si}^1{\rm H}^+/^{30}{\rm Si}^+ = {\rm I}(29 \:{\rm a.m.u.})/^{30}{\rm Si}^+ - 1.517 \end{eqnarray*} \begin{eqnarray*} ^{30}{\rm Si}^1{\rm H}^+/^{30}{\rm Si}^+ = ^{28}{\rm Si}^1{\rm H}^+/^{30}{\rm Si}^+ / 29.875 \end{eqnarray*} \begin{eqnarray*} ^{31}{\rm P}^+/^{30}{\rm Si}^+ = {\rm I}(31 \:{\rm a.m.u.})/ ^{30}{\rm Si}^+ - ^{30}{\rm Si}^1{\rm H}^+/^{30}{\rm Si}^+ \end{eqnarray*}
 |
| Figure 1 |
Bed X$_1$ contains morphologically diverse zircon grains and fragments (Figure 1) ranging from 30 to 100 $\mu$m. The aspect ratios of the grains vary from 1.2 to 4 (at an average of $1.95 \pm 0.64$), with a lognormal distribution, which indicates that the grains were disintegrated in the course of sedimentation, when angular fragments were produced. At the same time, it is pertinent to mention that acicular zircon grains are absent, whereas variably rounded grains are, conversely, abundant (Figure 1). The zircons are pink transparent and/or semitransparent or, more rarely, opaque.
 |
| Figure 2 |
 |
| Figure 3 |
The great morphological diversity of zircon in bed X$_1$ makes it possible to distinguish a number of groups: (1) cataclased, (2) oval, (3) euhedral and subhedral, and (4) corroded. It is worth mentioning that several zircons are cataclased; these were detected among the grains mounted on a double-sided adhesive tape and in the polystyrene pellet (Figure 2, Figure 3). The morphologies of the cataclased zircon grains are analogous to those of zircons in cataclased rocks [Zinger et al., 2010]. This does not rule out that the angular geometries were produced by breaking previously cataclased during sedimentation.
 |
| Figure 4 |
 |
| Figure 5 |
 |
| Figure 6 |
The zircon grains are often oval, corroded, or sub- to euhedral (Figure 4). We have also found unusual spongy zircons whose growth zones are riddled with round pores (Figure 5). Zircons of this type are not rare, and this led us to distinguish them as an individual group, which crystallized at different circumstances, simultaneously with the liberation of the gas phase from the rapidly decompressed melt. Originally the pores were mistaken for SiO$_2$ inclusions, but the EDS spectra showed lines of both Si and Zr. Several zircons bear inclusions, usually quartz, xenotime, plagioclase, occasional apatite, and even more rare pyrite (Figure 6). The corroded zircons host hollows left after the dissolution of mineral inclusions.
 |
| Figure 7 |
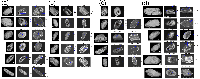
The morphology of 62 zircon grains was examined under an electron microscope, and their inner structure was studied in cathodoluminescence (CL) and back-scattered electrons (BSE). The most representative images are displayed in Figure 7.
The surface of most of the grains shows traces of cataclasis and destruction (grain 26, Figure 7a), numerous caverns (grains 6 and 19 in Figure 7a; 55 and 37 in Figure 7b; and 3, 12, 40, and 44 in Figure 7c). Some of the grains have completely porous spongy surface (grains 56, 25, and 23 in Figure 7a; 28 in Figure 7b; and 45 in Figure 7c). The prism faces of some grains are intersected by minute cracks (grains 32 and 34 in Figure 7b; 9, 13, 33, and 35 in Figure 7d). At the same time, some of the grains display evidence of partial dissolution and healing of prism faces (grains 9 and 59 in Figure 7d) and the growth of new faces of prisms and pyramids (grains 46, 33, and 35 in Figure 7d).
As can be seen in CL and BSE in sections of the same grains, they are highly heterogeneous: display thin 55, 37, 34, 45) or coarser (56, 19, 3) zoning or its fragments (6, 25, 23, 28, 3, 40, 9, 13, 59), can be partly recrystallized and unzoned (12, 44), or show evidence of the destruction of grain cores (26, 25, 55, 37, 32, 34, 46, 33). The character of the older "primary magmatic" zoning of the zircon grains suggests that they crystallized under different conditions and likely from differentiating melt. It is thereby important to emphasize that the surfaces of most of the zircons are cavernous and porous, in spite of the fact that these grains can have different inner structures.
A discrete group comprises zircons with evidence of postsedimentary transformations. Zircons of this group typically display traces of partial dissolution and redeposition of the material in minute healed cracks and spongy surface (9, 13, 59, 46, 33, 35) and the growth of newly formed crystal faces (33, 46, 35). This process can be discerned in the inner structure of the crystals as the development of minute veinlets (9, 46), banding (13, 40), and patchy patterns that can be seen in CL and BSE images. Thereby the destructed cores of the grains can be partly healed (32, 33, 34). Occasional crystals (13, 59, 33, 35) show the development of outer rims of various thickness, from a few to 15 $\mu$m.
The formation and transformation sequences of the zircon crystals led us to think that the youngest of these processes were related to postsedimentary and diagenetic processes of hydrothermal nature. Note that these processes affected already compositionally heterogeneous and variably modified zircon grains.
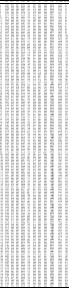 |
| Table 2 |
Table 2 reports 186 microprobe analyses of 62 zircon grains. Each of the grains was analyzed in its various parts, from the core to peripheral portions, to reveal possible compositional heterogeneities. To identify possible patterns and trends of the compositional variations, the analytical data were processed using factor analysis (method of principal components), which indicates that the compositional variations are controlled by variations in the concentrations of UO$_2$, ThO$_2$, and Y$_2$O$_3$ (factor 1) and ZrO$_2$ and SiO$_2$ (factor 2) (Table 2).
 |
| Figure 8 |
 |
| Figure 9 |
 |
| Figure 10 |
 |
| Figure 11 |
 |
| Figure 12 |
 |
| Table 3 |
The factor diagram (Figure 8) clearly demonstrates that most of the zircon bulk compositions define a clearly individualized data point swarm, with certain zircon compositions differing in having elevated Th, U, Y, and P concentrations, which usually increase from grain cores to their peripheries. This tendency is, in fact, described by factor 1 (Table 3). This trend is pronounced in binary diagrams for both the whole set of the zircon analyses (Figure 9, Figure 10) and individual grains (Figure 11, grains 33, 35, 46). The HfO$_2$–Y$_2$O$_3$ diagram (Figure 9) demonstrates the pronounced bimodal character of the distribution of the HfO$_2$ concentrations: $85\%$ of the grains contain $1.2\%$ HfO$_2$ on average, whereas a small fraction of the grains contain higher HfO$_2$ concentrations, up to 3.5% in grain 9 (Figure 12), as is typical of hydrothermally recycled zircon [Hoskin, 2005].
 |
| Figure 13 |
As can be seen in the ZrO$_2$–ZrO$_2/$HfO$_2$ diagram for all of the analyses (Figure 13), the ZrO$_2$ concentrations vary within a narrow range of 65–66%. The only exception is a single analysis (grain 55-1) reflecting the destruction of the crystal structure of the mineral. The ZrO$_2/$HfO$_2$ ratio varies from 80 to 30. Analyses of individual grains led us to conclude that lower ZrO$_2/$HfO$_2$ ratios can occur in both the rims of the crystals and their domain with disturbed crystal structure and developed in relation with transformations of the grains.
Analysis of the zircon grains in their various parts indicates that the zircons have a heterogeneous major-component composition, which can be identified because of the small beam diameter of the microprobe (3 $\mu$m), and this should be taken into account when data on the bulk, trace-element, and REE compositions of zircons are compared.
Zircon is known to contain, along with Zr, Si, and O, also Hf, Y, Th, U, P, Ca, Na, Fe, Al, Mn, Ti, Sr, Ba, and REE [Hoskin and Schaltegger, 2003], and hence, zircon analyses for trace elements and REE are widely utilized to reproduce (usually with the application of binary diagrams; [Grimes et al., 2007, 2009] and several others) the provenance of zircons found in sedimentary rocks.
 |
| Table 4 |
Table 4 presents the trace element and REE composition of 41 zircon grains, which were analyzed within their central parts (cores) and in the margins (the diameter of the electron beam was 25 $\mu$m). The table also reports the crystallization temperatures of the zircons calculated by the Ti thermometer [Watson et al., 2006].
 |
| Figure 14 |
 |
| Table 5 |
In order to identify possible correlations between the behavior of trace elements (without REE), we applied factor analysis, which demonstrates that all of our analyses can be classified into two groups according to the correlated behaviors of U, Y, and Th (factor 1, weight 32%) and Li and Hf (factor 2, weight 18%) (Table 5, Figure 14).
Similar to the classification by major components, most of our analyses define a fairly compact group. At the same time, some of the analyses are anomalous and principally differ from those combined in the group. It is worth mentioning grains 19, 25, and 33, whose major component and trace element compositions are anomalous (Figure 8, Figure 14) due to similarities between U, Y, and Th, which are combined within factor 1 in both instances. Another anomalous grain (grain 26) is extremely rich in Ti (115 ppm). We cannot rule out that a Ti-bearing inclusion occurred within the excitation spot of the ion probe beam and thus affected the analysis. The analyses of this grain were rejected from the temperature calculations.
The geochemical meaning of factor 1 is self-evident, because the variations in the U, Y, and Th concentrations are significant (Table 4), and correlations between these elements are strong $(r_{\rm Th, U} =0.86$ and $r_{\rm U, Hf} = 0.39)$.
Factor 2 involves two elements (Li and Hf), whose correlated coefficient is significant $(r = 0.53)$. The interpretation of factor 2 is determined by the bimodal distribution of the Li and Hf concentrations.
Analysis of the variations in the Li concentration indicates that a few of our zircon grains contain $<1 $ ppm Li (grains 3, 12, 13, 40, 44, 45, and 59), whereas all other grains (i.e., most grains in our selection) contain $>10$ ppm Li. Data on Li concentration in zircon of various genesis are still sparse. It is known that magmatic zircon that crystallized from magma of primitive composition contains $<8 $ ppm Li, while zircon from differentiated melts in the continental crust contains 10–70 ppm Li [Ushikubo et al., 2008]. At the same time, Li concentrations in zircons in gabbro in the continental crust and kimberlites are lower than 0.01 ppm, and these values vary from 0.1 to $>100$ ppm for zircon in the continental crust. According to [Spicuzza et al., 2012] the lower limit of Li concentration in zircons from the continental crust is close to 0.5 ppm.
If the aforementioned bimodality in the Li concentration of zircon is generally typical of magmatic rocks, which is indirectly corroborated by data on lunar zircon [Spicuzza et al., 2012], this fact is of paramount importance for zircon identification. It is important that data on the Li isotopic composition testify that the rate of Li selfdiffusion in zircons is low [Ushikubo et al., 2008].
This led us to conclude that the 62 zircon grains from bed X$_1$ comprise two zircon types, of course, with regard for the fact that the Li detection limit in this situation was 0.1 ppm.
The Hf concentration also shows a bimodal distribution. For example, anomalous grains 35 and 37 contain 11,415 and 13,833 ppm Hf, respectively, i.e., much more than the other grains do. A bimodal distribution can also be seen in the HfO$_2$–Y$_2$O$_3$ diagram, which also displays two zircon populations. High Hf concentrations are known to be indicative of hydrothermal alteration of zircon [Hoskin, 2005]. Mineralogical evidence confirming the effect of hydrothermal processes is quartz, xenotime, plagioclase, occasional, apatite, and even more rare pyrite inclusions in some zircons (Figure 6).
 |
| Figure 15 |
 |
| Figure 16 |
 |
| Figure 17 |
We can now discuss diagrams most commonly used to distinguish between zircon types [Grimes et al., 2007; and others]. In the Th–U diagram (Figure 15), most of the data points of zircons from bed X$_1$ plot within the field of zircons from the products of historical volcanic eruptions in Iceland and partly in the field of zircons in basalts from the Juan de Fuca and Mid-Atlantic ridges. The situation with the data points of the zircons in the U/Yb–Hf diagram is somewhat different: zircons from bed X$_1$ and zircons from Iceland lavas fall within the continental crust field (Figure 16). Other diagrams of this type (which are not presented here) rather demonstrate that it is not possible to use any two parameters, or their ratios, to identify the provenance of detrital zircon in sedimentary rocks. For example, the Ti–Y diagram (Figure 17) displays, unlike the Th–U diagram (Figure 15), that the trend for zircons of the MORB source divides our zircons into two roughly equal populations.
The chondrite-normalized REE patterns of zircon make it possible to distinguish three its types: magmatic, metamorphic, and hydrothermal [Hoskin and Schaltegger, 2003; Li et al., 2000; and others], which differ from one another in enrichment in LREE and Ce and Eu anomalies.
 |
| Figure 18 |
Our zircons are obviously enriched in LREE, show positive Ce and negative Eu anomalies (Table 3, Figure 18), and can be classed with the magmatic type, as can be seen by the overlap of their trends with those of zircons from oceanic gabbroids.
The REE patterns exhibit no evidence of hydrothermal alterations, because zircons from bed X$_1$ do not meet the main geochemical criterion for distinguishing hydrothermal zircons: LREE differentiation and a gradual decrease in the Ce anomaly.
An interpretation of the data obtained in the course of our study requires knowledge of the paleogeographic environment in which the bentonite was formed. It is known that bentonite can be of two types: purely volcanic one and that containing a few percent pelagic and terrigenous components and broadly variable contents of pyroclastic grains and nonvolcanic material [Thurow and von Rad, 1992].
Our data on the heavy fraction of the material of bed X$_1$ indicate that this material contains several minerals: garnet, rutile, leucoxene, xenotime, feldspars, Ni and Fe sulfides, magnetite, and titanomagnetite. Previously the most detailed data were obtained on the rutile, which was classified into six types, including this mineral from metamorphic rocks. This mineral association suggests that the material was supplied from more than one (at least two) sources: a distant volcanic one, which was related to the activity of the Iceland plume, and a proximal Alpine source of clastic material. At a conservative estimate of the sedimentation rate of about 2 cm per $10^3$ years [Egger et al., 2005], bed X$_1$ should have been produced fairly quickly (during approximately 1500 years), but the supply of terrigenous material to the sedimentation basin at a low sea level in the latest Paleocene-earliest Eocene should have been fairly significant [Kennett and Stott, 1991]. The bentonite of bed X$_1$ should thus be classed with a mixed type, and this put forth the question as to which criteria can be applied to elucidate the provenance of the zircons.
In analyzing binary diagrams commonly utilized to identify the nature of zircons, it was demonstrated that it is not possible to use any two trace elements or their ratios to identify the source of detrital zircons in sedimentary rocks.
 |
| Table 6 |
The crystallization temperatures of the zircons calculated with the Ti thermometer [Watson et al., 2006] broadly vary from 604 to 867° C at an average of $766 \pm 53$° C (grain 26 containing 115 ppm Ti was rejected) (Table 6). Currently available estimates of zircon crystallization temperatures vary within the range of $653 \pm 124$° C for acid magmatic rocks and $758 \pm 111$° C for mafic rocks [Fu et al., 2008].
Based on this criterion and with regard for the results of factor analysis of major and trace elements, it can be hypothesized that our zircons mostly affiliate with the magmatic (but not the hydrothermal or metamorphic) type. The data on the REE distribution testify to an oceanic nature of the magma. A more reliable criterion of an oceanic nature of the source is the Li concentration, with the concentrations of this element in some of the grains being much lower than the minimum values typical of the continental crust.
Our data on the morphology and inner structure of the zircons also suggest a magmatic genesis of most of these grains. It is pertinent to mention their distinctive features: their structure, which suggests that the zircons crystallized simultaneously with the dramatic decompression of the melt. Certain morphological features of the zircons, for instance, the occurrence of cataclased grains, make the zircons similar to this mineral from the Mid-Atlantic Ridge [Zinger et al., 2010].
At the same time, it is worth mentioning that several grains show obvious evidence of hydrothermal alteration, which affected both the morphology of the zircon grains and their inner structure, as can be seen in the CL images, and resulted in the high Hf concentrations. The currently widely used classification of zircons into continental and oceanic types [Grimes et al., 2007; and several others] does not cover all diverse types of magmatic zircons. The data presented above on Li concentrations in the zircons provide grounds to suggest that a zircon type can exist that is related to plume magmatism, which evolves regardless of the type of the crust and is controlled by processes at the Earth's core/lower mantle interface. An analogous conclusion was drawn in [Vasquez et al., 2010] based on data on zircon in gabbro and diorite xenoliths in the Holocene basalt of Hualali volcano in Hawaii; these researchers suggest to distinguish a zircon type related to hotspots (hot spot zircons).
This problem can be solved only via further studies of Li concentrations in magmatic zircons in lavas form oceanic islands and intraplate continental basalts (flood basalts in Siberia, Deccan, Ethiopia, etc.).
Bottazzi, P., L. Ottolini, R. Vannucci, and A. Zanetti (1994), An accurate procedure for the quantification of rare earth elements in silicates, SIMS IX Proceedings (eds. A. Benninghoven, Y. Nihei, R. Shimizu and H. W. Werner), Wileys, Chichester, 927–930.
Carley, T. L. (2010), Studies of the evolution of felsic magma systems: I. Zircon in historic eruptions, Iceland; II. Modeling magma chamber evolution leading to the peach spring tuff supereruption, Arizona, Nevada and California, Master Science Thesis, Nashville, 144.
Christidis, G. E., and W. D. Huff (2009), Geological aspects and genesis of bentonites, Elements, 5, 93–98, doi:10.2113/gselements.5.2.93.
Clayton, T., et al. (1996), The implications of reworking on the mineralogy and chemistry of Lower Carboniferous K-bentonites, Clay Minerals, 31, 377–390, doi:10.1180/claymin.1996.031.3.08.
Compston, W., et al. (1992), Zircon U–Pb ages for the Early Cambrian time-scale, J. Geol. Soc. London, 149, 171–184, doi:10.1144/gsjgs.149.2.0171.
Egger, H., and E. Bruckl (2006), Gigantic volcanic eruptions and climatic change in the early Eocene, Int. J. Earth Sci. (Geol. Rundsch), 95, 1065–1070, doi:10.1007/s00531-006-0085-7.
Egger, H., M. Homayoun, H. Huber, F. Rogl, and B. Schmitz (2005), Early Eocene climatic, volcanic, and biotic events in the northwestern Tethyan Untersberg section, Austria, Palaeogeography, Palaeoclimatology, Palaeoecology, 217, 243–264, doi:10.1016/j.palaeo.2004.12.006.
Fedotova, A. A., E. V. Bibikova, and S. G. Simakin (2008), Ion-microprobe zircon geochemistry as an indicator of mineral genesis during geochronological studies, Geochemistry International, 46, 912–927, doi:10.1134/S001670290809005X.
Fu, B., F. Z. Page, A. J. Cavosie, J. Fournelle, N. T. Kita, J. S. Lackey, S. A. Wilde, J. W. Valley (2008), Ti-in-zircon thermometry: applications and limitations, Contrib. Mineral. Petrol., 156, 197–215, doi:10.1007/s00410-008-0281-5.
Grimes, C. B., et al. (2007), The trace element chemistry of zircons from oceanic crust: a method for distinguishing detrital zircon provenance, Geology, 35, 643–646, doi:10.1130/G23603A.1.
Grimes, C. B., et al. (2009), On the occurrence, trace element geochemistry, and crystallization history of zircon from in situ ocean lithosphere, Contrib. Mineral. Petrol., 2009, doi:10.1007/s00410-009-0409-2.
Hinton, R. W., and B. G. J. Upton (1991), The chemistry of zircon: variations within and between large crystals from syenite and alkali basalt xenoliths, Geochim. Cosmochim. Acta, 55, 3287–3302, doi:10.1016/0016-7037(91)90489-R.
Hoskin, P. W. O. (2005), Trace-element composition of hydrothermal zircon and the alteration of Hadean zircon from the Jack Hills, Australia, Geochim. Cosmochim. Acta, 69, 637–648, doi:10.1016/j.gca.2004.07.006.
Hoskin, P. W. O., and U. Schaltegger (2003), The composition of zircon and igneous and metamorphic petrogenesis, J. M. Hanchar and P. W. O. Hoskin (eds.), Zircon, Mineral. Soc. America, Rev. Mineral. Geochem., 53, 27–62.
Huber, H., C. Koeberl, and H. Egger (2003), Geochemical study of lower Eocene volcanic ash layers from the Alpine Anthering Formation, Austria, Geochemical Journal, 37, 123–134, doi:10.2343/geochemj.37.123.
Jochum, K. P., et al. (2000), The preparation and preliminary characterisation of eight geological MPI-DING reference glasses for in-situ microanalysis, Geost. Newslett., 24, 87–133, doi:10.1111/j.1751-908X.2000.tb00590.x.
Kennett, J. P., and L. D. Stott (1991), Abrupt deep-sea warming, paleoceanographic changes, and benthic extinctions and the end of the Paleocene, Nature, 353, 225–229, doi:10.1038/353225a0.
Larsen, L. M., J. G. Fitton, and A. K. Pedersen (2003), Paleogene volcanic ash layers in the Danish Basin: compositions and source areas in the North Atlantic Igneous Province, Lithos, 71, 47–80, doi:10.1016/j.lithos.2003.07.001.
Li, X., X. Liang, M. Sun, Y. Liu, and T. Xianglin (2000), Geochronology and geochemistry of single-grain zircons: Simultaneous in-situ analysis of U-Pb age and trace elements by LAM-ICP-MS, Eur. J. Mineral., 12, 1015–1024.
McDounough, W. F., and S.-S. Sun (1995), The composition of the Earth, Chem. Geol., 120, 223–253, doi:10.1016/0009-2541(94)00140-4.
Nosova, A. A., L. V. Sazonova, V. V. Narkisova, and S. G. Simakin (2002), Minor elements in clinopyroxene from Paleozoic volcanics of the Tagil Island Arc in the Central Urals, Geokhimiya, 40, 254–268.
Schmitt, A. K., et al. (2011), Rapid cooling rates at an active mid-ocean ridge from zircon thermochronology, Earth and Planet. Sci. Lett., 202, 349–358, doi:10.1016/j.epsl.2010.12.022.
Seifert, W., D. Rhede, O. Tietz (2008), Typology, chemistry and origin of zircon from alkali basalts of SE Saxony (Germany), Neues Jahrbuch fur Mineralogie Abhandlungen, 184, 299–313, doi:10.1127/0077-7757/2008/0102.
Smirnov, V. K., et al. (1995), Quantitative SIMS analysis of melt inclusions and host minerals for trace elements and H$_2$O, EOS Trans. Spring Meet. Suppl., AGU, 17, 270.
Spicuzza, M. J., J. W. Valley, and T. Ushikubo (2012), Li concentration and isotope ratio in lunar zircons: Li-enriched and depleted magmas on the Moon, 43rd Lunar and Planetary Science Conference.
Thurow, J., and U. von Rad (1992), Bentonites as tracers of earliest Cretaceous post-breakup volcanism off northwestern Australia, Gradstein F. M., Ludden, J. N., et al., Proceedings of the Ocean Drilling Program, Scientific Results, 123, 89–105.
Ushikubo, T., et al. (2008), Lithium in Jack Hills zircons: Evidence for extensiveweathering of Earth's earliest crust, Earth Planet. Sci. Lett., 272, 666–676, doi:10.1016/j.epsl.2008.05.032.
Vasquez, J. A., I. N. Bindeman, P. J. Shamberger, and J. E. Hammer (2010), Trace elements and oxygen isotope composition of Hawaiian hotspot zircon, Am. Geoph. Un., Fall Meeting, V41B-2275.
Watson, E. B., D. A. Wark, and J. B. Thomas (2006), Crystallization thermometers for zircon and rutile, Contribs Miner. Petrol., 151, 413–433, doi:10.1007/s00410-006-0068-5.
Zachos, J. C., et al. (2005), Rapid acidification of the ocean during the Paleocene–Eocene thermal maximum, Science, 308, 1611–1615, doi:10.1126/science.1109004.
Zinger, T. F., N. S. Bortnikov, E. V. Sharkov, S. E. Borisovskii, and A. V. Antonov (2010), Influence of Plastic Deformations in Zircon on its Chemical Composition: Evidence From Gabbroids of the Spreading Zone of the Mid-Atlantic Ridge, Markov Trough, 6° N, Doklady Akademii Nauk, Earth Sciences, 433, part 2, 1098–1103.
Received 28 January 2014; accepted 28 January 2014; published 11 February 2014.

Citation: Grachev A. F., S. E. Borisovsky, T. F. Zinger (2014), Morphology and geochemistry of zircon in bentonite ash at the Paleocene-Eocene boundary in the Anthering Formation, Eastern Alps, Austria, Russ. J. Earth Sci., 14, ES1001, doi:10.2205/2014ES000535.
Copyright 2014 by the Geophysical Center RAS.