RUSSIAN JOURNAL OF EARTH SCIENCES, VOL. 19, ES2004, doi:10.2205/2019ES000655, 2019
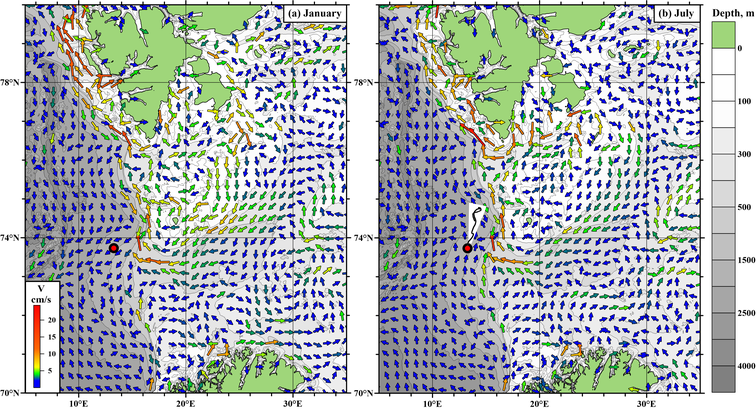
Figure 1. Simulated velocities of the bottom circulation in the Norwegian Sea in January (a) and July (b). Location of the submarine on the bottom is indicated with a red dot. Progressive vector from Figure 3 is superimposed on the chart in Figure 1b.

![]()
Citation: Morozov E. G., D. I. Frey, N. A. Diansky, V. V. Fomin (2019), Bottom circulation in the Norwegian Sea, Russ. J. Earth Sci., 19, ES2004, doi:10.2205/2019ES000655.
Copyright 2019 by the Geophysical Center RAS.
Generated from LaTeX source by ELXpaper, v.2.0 software package.