RUSSIAN JOURNAL OF EARTH SCIENCES, VOL. 17, ES2001, doi:10.2205/2017ES000594, 2017
A. E. Roshdestvensky, G. A. Malyshev
Physics and Technology Corporation, NRS, Moscow, Russia
Based on monthly climate data of temperature and air pressure at the standard geopotential surfaces we construct the structure and intensity of zones of divergence of heat in the atmosphere of the North hemisphere. It was found that the heat zone of the atmosphere as the heat sources are located in the marginal zones of large-scale ocean–continent.
In the World Ocean sensible and latent heat enters the atmosphere most intensively in local areas [Lappo at al., 1984]. The question is how the heat coming to the atmosphere from the oceans and continents is distributed in the atmosphere. The atmosphere zones of divergence of heat flux that can be regarded as a source of heat in the atmosphere. Since the specific heat capacity of air is three orders of magnitude smaller than that of water, a possible large-scale zone of the atmosphere as sources of heat distribution must be associated with the increased flux of heat from the Earth's surface. Is it really so? Are there similar zones in the Earth's atmosphere and what is their structure – the answer to this question for the Northern hemisphere is presented in this work.
The transfer of heat from one of the layers or parts of the atmosphere to another is produced by air motions, radiation heat transfer, the thermal conductivity of the air (mostly turbulent). We consider large-scale heat transfer (from 1000 to 10,000 km), which is not less than 90% belongs to geostrophic motions [Gulev and Lappo, 1984].
Works on the study of large-scale heat transfer structures in the atmosphere are extensive. The meridional heat transfer studies in [Trenberth and Caren, 2013; Wunsch, 2005], combine the heat transfer in the ocean and the atmosphere [Farneti and Wallis, 2013; Magnusdotter and Savaranan, 1999]. The present work differs in that it is carried out to study the large-scale heat transport in the Northern hemisphere based on the spatial-mean differences in the fields of pressure and temperature (phase shift) [Roshdestvensky and Roshdestvensky, 2016]. The first results of such research are reflected in [Malyshev, 1992; Roshdestvensky and Lappo, 1989].
To highlight large-scale zones of divergence of heat flux in the atmosphere (as heat sources ) compute the heat flux, carried out with movement through the lateral border of each selected basic block of the atmosphere.
The calculations use Mercator grid of the Earth with horizontal sizes $5 \times 10$ grad. and the monthly climate data fields of temperature and pressure (geopotential) of air, surface and standard geopotential surfaces and the atmosphere [Malyshev, 1992]. The core data on isobaric surfaces were averaged for the period 1969–1991, surface data for the period 1881–1991.
Horizontal heat transfer ($Q$) by air movements through the lateral surface of the contour ($L$) on the isopotential surface is equal to:
\begin{eqnarray*} Q= C \oint_L \rho (x, t) T(x, t) v (x, t) d L \end{eqnarray*}where $C$ is the air specific heat capacity, $\rho$ is the air density, $T$ – temperature, $v$ – speed, $L$ – element of the counter. The normal to the contour of the geostrophic velocity is equal to:
\begin{equation} \tag*{(1)} (V_g)_n = \frac{1}{\rho f} \frac{\partial P}{\partial L} \end{equation}where $P$ is the atmospheric pressure. Consequently, the heat transfer through the circuit ($L$) as (1), has the form
\begin{equation} \tag*{(2)} Q = C \oint_L \rho T V_n dL = \frac{c}{\rho f} \oint_L T \frac{\partial P}{\partial L} dL = \mathrm{const}^* \Delta \varphi \end{equation}Here (2) is a spatial shift in the fields of temperature and air pressure across the counter ($L$), can be represented as
\begin{eqnarray*} \Delta \varphi_L = \frac{1}{\Delta T \Delta P} \oint_L T \frac{\partial P}{\partial L} dL \end{eqnarray*}where $\Delta T$, $\Delta P$ are modules of the maximum differences of values of $T$, $P$ on the contour. Thus the removal of heat through the boundary of a path in this approximation is determined by the shear differences in the fields $T$, $P$, which is a measure of the shear phase $\Delta \varphi_L$. The method of calculation of heat sources in the atmosphere (Eq. (2)) is the most effective for studying large-scale heat transfer in mid- and high-latitude areas where large-scale movements in the layer tangential the earth's surface are geostrophic.
We use monthly climatic data of temperature and geopotential in the knots Mercator grid $5 \times 10$-degree grid of the Northern hemisphere in the surface layer and 8 isobaric surfaces 850–30 mbar. For each elementary circuit (quadrilateral $5 \times 10$% on isobaric surfaces was calculated the value of the divergence of the heat flux according to (2)). The core data on isobaric surfaces were averaged for the period 1969–1991, the surface data for the period 1948–1991.
For each isobaric surface of calculated values (Eq. (2)) a map of isolines of equal divergences of flow was built. Positive $Q$ values correspond to the release of heat from the circuit, negative $Q$ values we associate with areas of heat absorption. Finally, the maps of the Northern hemisphere for 8 isobaric surfaces were obtained as well as for the surface layers for each of the 12 climate months, and the averaged for the seasons and for the whole year, including integrated atmosphere data for the surface layer.
|
| Figure 1 |
The results of the calculations revealed an unexpected, but fully understandable picture. It turned out that the zone of divergence of the large scale flow does not form the map of a small mosaic picture with different characters but are merged in homogeneous zones. The contours of these zones remain virtually all qualitative and structural features when the scale of the computational grid on the surfaces is changed to 500, 700, 850–1050 mbar. The structure of the heat transfer in the surface layer on the surface 850 mbar is in good agreement with the structure integrated over the height of the heat transfer in the atmosphere. Maps of large-scale areas of the installment and removal of heat in the atmosphere are not strictly follow the contours of the oceans and continents. The characteristic map of the areas of sources and sinks of heat in the atmosphere is given in Figure 1, which shows a structure of divergence of large-scale heat transfer in the Northern hemisphere over 20° latitude at the isobaric surface 850 mbar.
Figure 1 shows that the boundary zones in the atmosphere between the ocean and the mainland in winter are a powerful climatic heat source. In summer, a strong heat source is the mainland, while ocean is absorber. In general, the year's most potent sources and sinks of heat are located in edge zones (sources) in the center of the oceans and continents (effluents).
 |
| Figure 2 |
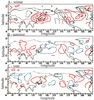
Figure 2 represents the sources and sinks of heat in the atmosphere in an average year on the surface of 1013 mbar, 850 mbar, 700 mbar, 500 mbar, 300 mbar. Red counter marks the heat, the black contour limits the zone of heat absorption. The most powerful heat area in atmosphere is situated on the border of the continent of Asia and ocean manifest at all altitudes.
 |
| Figure 3 |
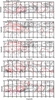
The top panel of Figure 3 shows the map of heat flow in an average year, identical to Figure 2, calculated from monthly climate data, and then summarized by month. Here are the total heat sources, which include springs due to the constant parameters, and by their vibrations, these sources are denoted as $$. The bottom panel of Figure 3 shows the map of the sources of heat, as the difference between the maps above and below, i.e. as value $\tilde{Q} =(
- \bar{Q})$. It is obvious that the value appears due to the seasonal variations of the governing parameters in the annual cycle. In Figure 3 region, where the amount is not filled with crosses ($x$) in these areas, seasonal fluctuations increase permanent climatic heat sources.
It is interesting that these positive areas coincide with the powerful heat source in the Asia-Pacific region (with a small offset to the South), East and North-West coast of America, across the waters of the Arctic ocean. It is interesting that overall, Asia as a continent is also generally in the Central and Northern part of the source of heat in the atmosphere due to seasonal variations of temperature and geopotential. Zones of the flow of heat due to the seasonal fluctuations have the form of interlayers between the regional and Central mainland regions (Euro-Asia), and behave differently in the Atlantic and on the American continent. Analysis of these differences awaits further researchers. But here, in the locations of energy-active zones of the ocean (California, the Gulf Stream-Bermuda) we observe local areas of the atmosphere where the seasonal cycle amplifies climate sources of heat.
 |
| Figure 4 |
Figure 4 shows the maps of the regions of the atmosphere at different isobaric surfaces where seasonal fluctuations in climate increase the heat sources. These areas are not shaded. In contrast to Figure 3, in Figure 4 region heat increasing is not shaded and the shaded region here reduce contribution to the heat sources due to seasonal variations.
In general, qualitative picture of the contribution of seasonal variations in heat sources at different heights and ground level data in Figure 4 qualitatively similar to the pattern on the surface of 850 mbar (see Figure 3 and Figure 4). Differences begin to emerge more significantly since the height of 500 mbar and above.
Atmospheric zones at different heights (Figure 4, filled crosses), increase the release of heat from these zones due to seasonal fluctuations. The most powerful climatic zones removal of heat in the atmosphere (as well as the removal of "cold") are observed in the whole thickness of the atmosphere from the surface layer to altitudes of 25–30 km with a small displacement relative to each other on the heights of 1–7 km.
It is found that the main climatic atmospheric heaters are not the actual oceans or continents, but large-scale border regions between the latter. With a share conditional simplification it can be argued that the atmosphere of the Northern hemisphere is warmer than the southern one due to the presence of large-scale border zones ocean–continent. The atmosphere is not heated by continents as such, but border structures of the Earth's surface between the oceans and the continents due to the fact that continents are located predominantly in the northern hemisphere. This is quite ironic when you consider that the fraction of the solar heat absorbed by the earth's surface in the southern hemisphere is higher than in the northern one.
Water vapor entering the atmosphere above the boundary energy-active zones of the ocean, partially "works" over the continents with the release of heat during condensation in the process of seasonal monsoon activities, forming the core of the heat source in the border zone of the continent. These findings have a simple interpretation in terms of shear (integral) phase [Roshdestvensky and Roshdestvesky, 2016]. The intensity of the heat sources in the atmosphere depends on the spatial mismatch of large-scale fields of pressure and temperatures, (2) the Gradient of the surface air pressure present in the form of the sum of the gradients of temperature and the partial pressure of water vapor $E$ in the form:
\begin{equation} \tag*{(3)} \nabla P = (\mathrm{const})_1 (\nabla T) + (\mathrm{const})_2 (\nabla E) \end{equation}Substituting (3) into (2) we have (4), given the identity
\begin{eqnarray*} \oint_L T \frac{\partial T}{\partial L} dL \equiv 0 \end{eqnarray*}\begin{equation} \tag*{(4)} Q (t) = \mathrm{const} \oint_L T \frac{\partial E}{\partial L} dL \end{equation}
It is assumed that equations (2) and (4) have known parameters, including Coriolis parameter as a function of geographical latitude. According to (4) the main contribution to the emergence of "sources" of heat in the atmosphere, as areas of large-scale divergence of fluxes of heat, making the moisture. The structure of the fields of humidity in the atmosphere is not similar to the structure of the temperature field, which leads to the occurrence of regions with significant shear phases in the fields of pressure and temperature, from where there are dynamic effects in the form of the appearance in the atmosphere of large-scale sources and sinks of heat (4). The largest phase mismatch of humidity and air temperature fields in the climate system is observed in the border (transitional) areas of ocean-continent, these areas are located sources of intense heat removal in the atmosphere.
Farneti, R., G. Vallis (2013), Meridional energy transport in the coupled atmosphere–ocean system compensation and portioning, J. Clim., 26, p. 7151–7166, doi:10.1175/JCLI-D-12-00133.1.
Gulev, S. K., S. S. Lappo (1984), Large-Scale Ocean and Atmosphere Interaction. Review, VNIGNI, IDC, Obninsk.
Lappo, S. S., et al. (1984), The energy-active zones of the world ocean, DAN SSSR, 275, no. 4, p. 217–222.
Magnusdotter, G., R. Saravanan (1999), The response of atmospheric heat transport to zonally averaged SST trends, Tellus, 21, p. 1–17.
Malyshev, G. A. (1992), Large-scale heat transfer in the atmosphere over the oceans, The thesis and abstract of the thesis of cand. phys.-math. sci., State Oceanographic Inst., Moscow.
Roshdestvensky, A. E., S. S. Lappo (1989), Large-scale heat transfer between the ocean and atmosphere in the annual cycle, DAN SSSR, 301, no. 1, p. 87–92.
Roshdestvensky, A. E., S. A. Roshdestvensky (2016), Harmonic (mathematics) and shear (physical) phase, International Research Journal, 50, no. 8, p. 145–149.
Trenberth, K. E., J. M. Caren (2013), Estimates of meridional atmosphere and ocean heat transport, J. Clim., 14, p. 7151–7166.
Wunsch, C. (2005), The total meridional heat flux and its oceanic and atmosphere partition, J. Clim., 18, p. 4374–4380, doi:10.1175/JCLI3539.1.
Received 23 December 2016; accepted 16 January 2017; published 23 February 2017.

Citation: Roshdestvensky A. E., G. A. Malyshev (2017), Large-scale thermal zone of the atmosphere above the oceans and continents, Russ. J. Earth Sci., 17, ES2001, doi:10.2205/2017ES000594.
Copyright 2017 by the Geophysical Center RAS.