INTERNATIONAL JOURNAL OF GEOMAGNETISM AND AERONOMY VOL. 5, GI3009, doi:10.1029/2004GI000081, 2005
5. Reconstruction of
ne(h) Profiles
[17] The condition
ne/(2p f)  1 is fulfilled for the sounding signals in
the
E and
F ionospheric regions It makes it possible to simplify
considerably calculations of radio wave propagation. It was shown first
numerously
[Beynon and Jones, 1965;
Titheridge, 1967]
and later
analytically
[Vodolazkin et al., 1989a, 1989b]
that the use of the
linearized in terms of
ne absorption coefficient
k in formula (5) makes it
possible to obtain values which almost do not differ from the results of
the full-wave theory. Therefore for the
E and
F regions expression (5)
may be presented in the form
1 is fulfilled for the sounding signals in
the
E and
F ionospheric regions It makes it possible to simplify
considerably calculations of radio wave propagation. It was shown first
numerously
[Beynon and Jones, 1965;
Titheridge, 1967]
and later
analytically
[Vodolazkin et al., 1989a, 1989b]
that the use of the
linearized in terms of
ne absorption coefficient
k in formula (5) makes it
possible to obtain values which almost do not differ from the results of
the full-wave theory. Therefore for the
E and
F regions expression (5)
may be presented in the form
 | (13) |
where
K is the kernel which does not depend on the collision frequency.
5.1. E Layer
[18] The determination of the effective collision frequency in this
layer was performed to check the agreement between the gas-kinetic
evaluations and the "point"
(that is, related to a narrow height interval)
empirical estimates
[Danilkin et al., 1978].
To do this, the absorption
measurements of "o" waves at two frequencies
f1=2 MHz and
f2=2.25 MHz
were used. The absorption at the
f1 frequency and virtual heights of
the "o"
trace in the ionogram from the frequency interval including
f2 were the initial data for the determination of the
h0 and
H parameters of
the model (8). After restoration of the
N(h) profile which was assumed to
be applicable up to the reflection level
hr(f2) of the second frequency, for
this frequency the input into the absorption of the region
h hr(f1) and the
absorption
D L(f2) for the interval from
hr(f1) to
hr(f2) were calculated.
Taking into account the linearized formula (13) the absorption was
presented in the form
[Danilkin et al., 1978]
hr(f1) and the
absorption
D L(f2) for the interval from
hr(f1) to
hr(f2) were calculated.
Taking into account the linearized formula (13) the absorption was
presented in the form
[Danilkin et al., 1978]
 |
where
ne is some mean value of the collision frequency over the height
interval from
hr(f1) to
hr(f2) and
G is the value depending for each
observation point only on the working frequencies
f1 and
f2.
The value of
was easily estimated from the above formula. Because of regular
diurnal variations of the electron concentration and also variations in
solar activity the position of the interval
D h = hr(f2) - hr(f1) also varied
and that made it possible to study the vertical profile of the collision
frequency.
|
|
Figure 3
|

|
|
Figure 4
|
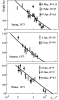
[19] The results of the determination at Rostov on Don for three
seasons (spring, summer, and winter) of 1973 are presented in Figure 3.
For the sake of comparison the results of the gas-kinetic calculations are
also shown in Figure 4. One can see that a satisfactory agreement exists
between the theory and experiment. Similar conclusions follow from the
experimental estimates of
ne by
Beynon and Jones [1965],
Ganguly [1974], and
Ganguly and Jain [1975].
The analysis of the specifics of the
Appleton method showed
[Vodolazkin et al., 1989a]
that the results
obtained on its basis are not reliable in the
E layer. The error due to the
errors in measurements of virtual heights reaches 100%. At the same
time, similar estimates for the maximum of the
F region should be taken
into account because their errors are only a few tens of percents and do
not cover the discrepancies between the theory and experiments.
5.2. Valley and F Region
[20] The experimental
ne(h) profiles were determined in several
stages. At the first stage simplified calculation schemes
[Danilkin et al., 1975, 1976]
of radio wave absorption measurements only of the ordinary
polarization and only in the daytime were used. In all intervals between
the adjacent levels of radio wave absorption
hi and
hi-1 the same
approximation was accepted
 | (14) |
For the height interval including the valley it gave at the bottom of the
F region the collision frequencies below the gas-kinetic ones. Later on
when it was found that empirical estimates of
ne cannot be less than the
gas-kinetic ones, this model for the interlayer region was substituted by
 | (15) |
with
p>1 [Vodolazkin et al., 1983].
Therefore at the second stage the
calculation of
ne(h) profiles was performed using the approximations
(14) and (15). Using this method the
[Vodolazkin et al., 1983]
empirical
model was created. It uses the data on the absorption of "
o " waves
obtained at 10 frequencies from the 2.00-6.25 MHz range during 1973
( F10.7=100).
It manifests only the seasonal variations of
ne(h) below 200 km
in the daytime. The model was obtained by an averaging of 51, 17,
and 20, and 20 individual
ne(h) profiles for spring, summer, fall, and
winter, respectively. The results are presented in Figure 4.
[21] Restoration of individual
ne(h) profiles and their averaging
showed that the discrepancy between the experiment and theory exists
only in the
F region, the empirical dependencies showing smaller vertical
gradient. So a special method of calculations of
ne(h) profiles only in the
F region was developed
[Vodolazkin et al., 1979]
for the model
 | (16) |
The averaged results of the
ne determination for winter and summer of
1979 obtained on the basis of the measurements of the "
o " waves
absorption in the after dusk period are also presented in Figure 4. One
can see that in the
F region the empirical estimates of
ne exceed the gas-kinetic ones by a factor of 2-6 and more than by a
factor of 10 in the
daytime and at night, respectively.
In the gas-kinetic calculations of
ne(h) for the given geophysical
conditions one has to use model values of
Te and concentrations of the
multicomponent atmosphere. They correspond to some average situation
and for each particular case may have considerable differences, the latter
fact leading to a large uncertainty in
ne(h).
So rocket-ground-based
experiments have been conducted. They had two goals. The main one
was to obtain the data (concentration of electrons and neutral particles,
and electron temperature) for the gas-kinetic calculations of the collision
frequency. The second goal was to exclude the errors appearing at
calculating of nonmonotonous
N(h) profiles from the data of the
ground-based vertical sounding (VS) and to check the accuracy of their
reconstruction in the entire inner ionosphere.

|
|
Figure 5
|

|
|
Figure 6
|
[22] It was shown in the rocket-ground-based experiments that the use
of direct measurements of the needed parameters for gas-kinetic
estimates in the
F region does not eliminate the discrepancy between the
theory and experiments. The discrepancy still takes place reaching an
order of magnitude and more
[Danilkin et al., 1989].
An example of the
comparison of such results for one of rocket flights is presented in
Figure 5
[Biryukov et al., 1980].
Thus, in the
F region all experimental estimates
of the collision frequency based on the VS by "o"
waves exceed the gas-kinetic evaluations. The comparison
of the rocket
N(h) profiles to the
profiles based on the VS data showed their satisfactory agreement
[Danilkin et al., 1989]
(see Figure 6). This means that reconstruction of
ne(h) profiles on the basis of only VS data does not introduce rough
errors.

Citation: Danilkin, N. P., P. F. Denisenko, B. G. Barabashov, and G. G. Vertogradov (2005), Electron collision frequency and HF waves attenuation in the ionosphere, Int. J. Geomagn. Aeron., 5, GI3009, doi:10.1029/2004GI000081.
Copyright 2005 by the American Geophysical Union
Powered by TeXWeb (Win32, v.1.5).