RUSSIAN JOURNAL OF EARTH SCIENCES, VOL. 20, ES4008, doi:10.2205/2020ES000737, 2020
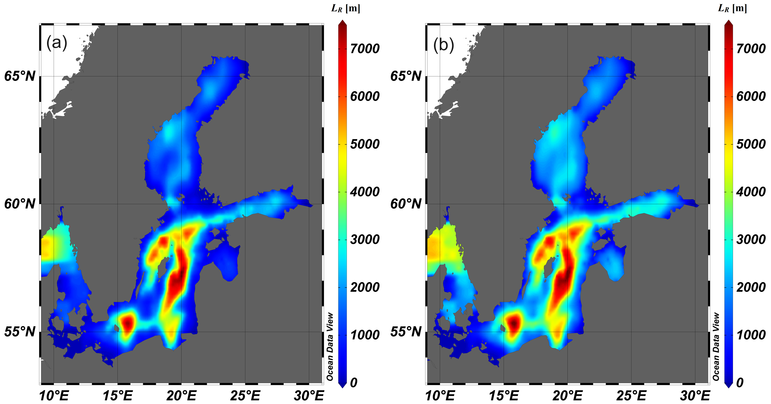
Figure 1. Maps of baroclinic Rossby radius $L_R$ (1) in the Baltic Sea calculated for January (left) and July (right). These and other maps in this paper are drawn using Ocean Data View software Stepanov, 2017 (Schlitzer, R., 2020, Ocean Data View, http://odv.awi.de.

![]()
Citation: Kurkin A.,
O. Kurkina, A. Rybin, T. Talipova (2020), Comparative analysis
of the first baroclinic Rossby radius in the Baltic, Black,
Okhotsk, and Mediterranean seas, Russ. J. Earth Sci.,
20, ES4008, doi:10.2205/2020ES000737.
Copyright 2020 by the Geophysical Center RAS.
Generated from LaTeX source by ELXfinal, v.2.0 software package.