RUSSIAN JOURNAL OF EARTH SCIENCES, VOL. 20, ES6011, doi:10.2205/2020ES000720, 2020
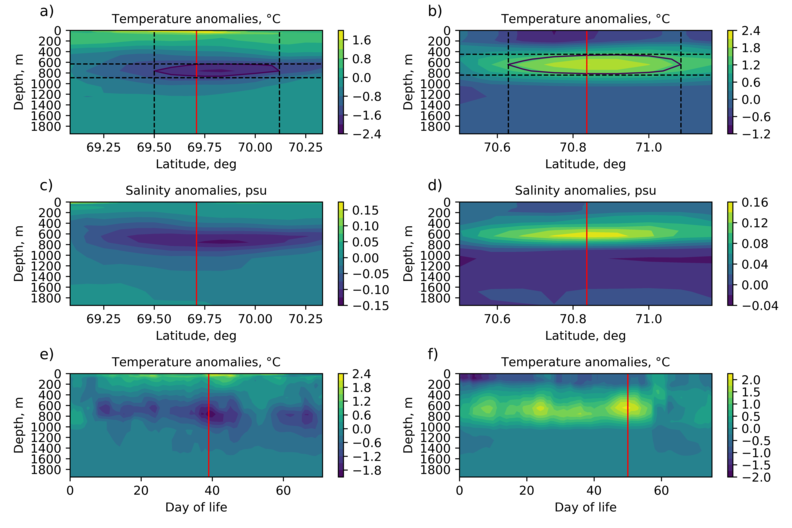
Figure 6. The cyclonic eddy (CE) (on the left) and the anticyclonic eddy (ACE) (on the right) for the Group 3: temperature anomalies (a), (d), salinity anomalies (b), (e), temporal variability of temperature anomalies for CE (c) and ACE (f). The red line shows the position of the eddy center according to altimetry data. Dashed lines indicate the eddy border.

![]()
Citation: Belonenko
Tatyana, Vadim Zinchenko, Svetlana Gordeeva, Roshin P. Raj
(2020), Evaluation of heat and salt transports by mesoscale
eddies in the Lofoten Basin, Russ. J. Earth Sci., 20,
ES6011, doi:10.2205/2020ES000720.
Copyright 2020 by the Geophysical Center RAS.
Generated from LaTeX source by ELXfinal, v.2.0 software package.