RUSSIAN JOURNAL OF EARTH SCIENCES, VOL. 20, ES6011, doi:10.2205/2020ES000720, 2020
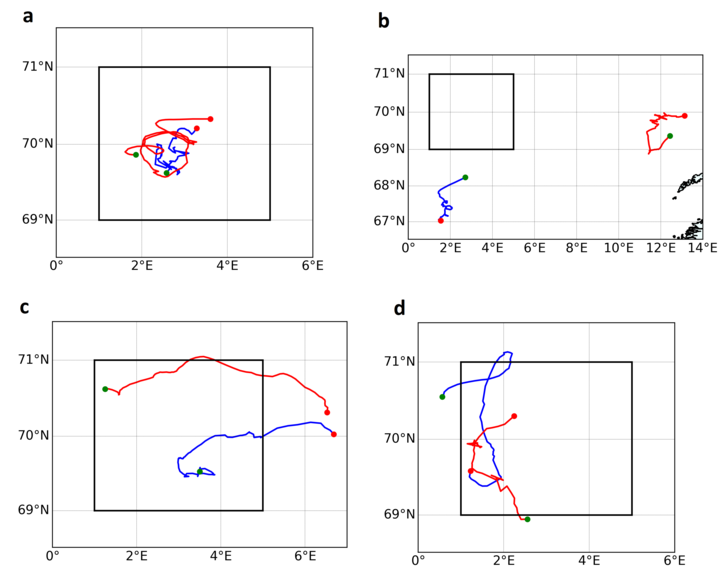
Figure 3. Tracks of analyzed long-lived eddies: (a) – Group 1, area 1, (b) – Group 2, area 2, (c) – Group 3, (d) – Group 4. The black rectangle shows the area of the Lofoten vortex (area 1). Blue lines display the cyclonic and red lines the anticyclonic eddies. The red points exhibit the location of the eddy generation, and the green points show the location of eddy dissipation.

![]()
Citation: Belonenko
Tatyana, Vadim Zinchenko, Svetlana Gordeeva, Roshin P. Raj
(2020), Evaluation of heat and salt transports by mesoscale
eddies in the Lofoten Basin, Russ. J. Earth Sci., 20,
ES6011, doi:10.2205/2020ES000720.
Copyright 2020 by the Geophysical Center RAS.
Generated from LaTeX source by ELXfinal, v.2.0 software package.