RUSSIAN JOURNAL OF EARTH SCIENCES, VOL. 20, ES6011, doi:10.2205/2020ES000720, 2020
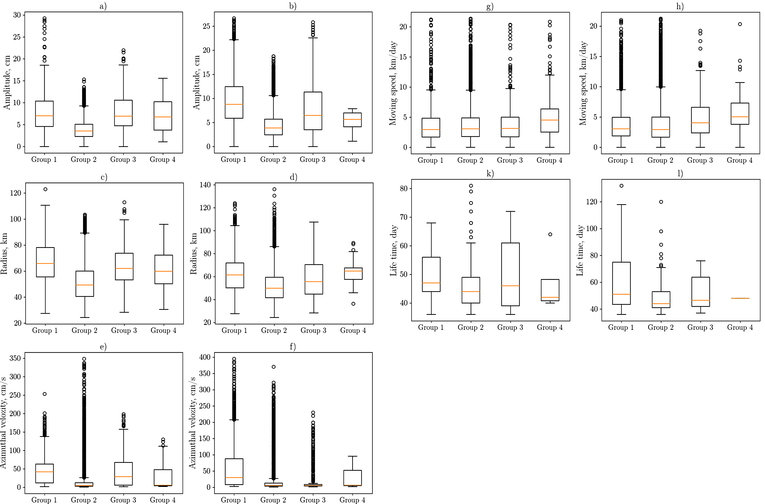
Figure 2. Box plot with whiskers for amplitude (cm), radius (km), azimuthal velocity (cm/s), moving speed along the tracks (km/day), a lifetime of CEs (on the left) and ACEs (on the right). The box sizes are 25–75% quantiles (Q1 = 25%, Q3 = 75%), the low ends of the whiskers are Q$1-1.5 \times$(Q2–Q1), the upper ends of the whiskers are Q$3+1.5 \times$(Q2–Q1), the yellow lines inside boxes indicate medians, the circles indicate outlier data.

![]()
Citation: Belonenko
Tatyana, Vadim Zinchenko, Svetlana Gordeeva, Roshin P. Raj
(2020), Evaluation of heat and salt transports by mesoscale
eddies in the Lofoten Basin, Russ. J. Earth Sci., 20,
ES6011, doi:10.2205/2020ES000720.
Copyright 2020 by the Geophysical Center RAS.
Generated from LaTeX source by ELXfinal, v.2.0 software package.