RUSSIAN JOURNAL OF EARTH SCIENCES, VOL. 20, ES3003, doi:10.2205/2020ES000712, 2020
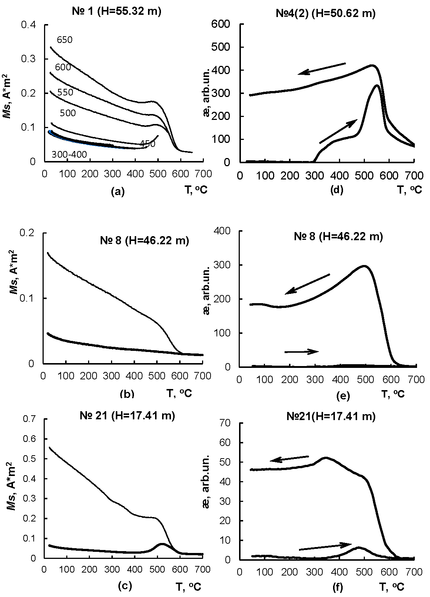
Figure 3. Partial curves of the saturation magnetic moment as a function of temperature in a constant magnetic field of $0.7 T$ (a). The numbers around the curves indicate heating temperatures. Curves of thermomagnetic analysis of the dependence $Ms (T)$ – (b–k). Bold line is the curve of the first heating, thin line is the curve of the second heating. Magnetic susceptibility dependence curves ${\ae}$ on temperature $T$ of the heating-cooling cycle (d, e, f).

![]()
Citation: Pilipenko O. V., E. V. Filina, Yu. V. Rostovtseva, Z. Novruzov (2020), Petromagnetism and paleomagnetism of the Tarkhanian sediments in Kop-Takyl section (the Kerch Peninsula), Russ. J. Earth Sci., 20, ES3003, doi:10.2205/2020ES000712.
Copyright 2020 by the Geophysical Center RAS.
Generated from LaTeX source by ELXfinal, v.2.0 software package.