RUSSIAN JOURNAL OF EARTH SCIENCES, VOL. 20, ES2002, doi:10.2205/2020ES000694, 2020
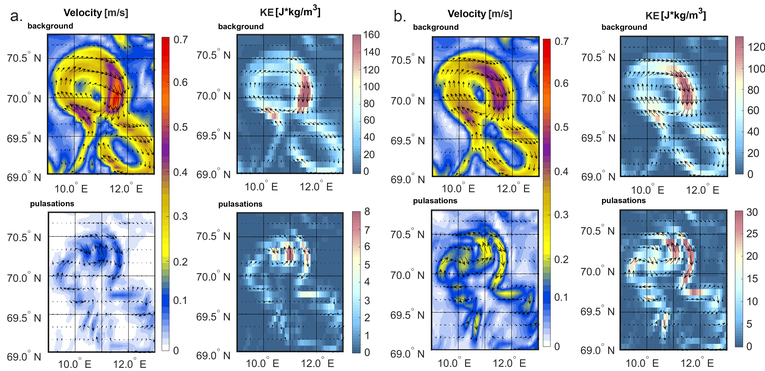
Figure 4. Spatial distribution of velocities and related kinetic energy for the background current (top row) and pulsations and kinetic energy (bottom row) for $T = 3$ days (a), $T = 7$ days (b).

![]()
Citation: Fedorov Aleksandr M., Tatyana V. Belonenko (2020), Interaction of mesoscale vortices in the Lofoten Basin based on the GLORYS database, Russ. J. Earth Sci., 20, ES2002, doi:10.2205/2020ES000694.
Copyright 2020 by the Geophysical Center RAS.
Generated from LaTeX source by ELXfinal, v.2.0 software package.