RUSSIAN JOURNAL OF EARTH SCIENCES, VOL. 20, ES2002, doi:10.2205/2020ES000694, 2020
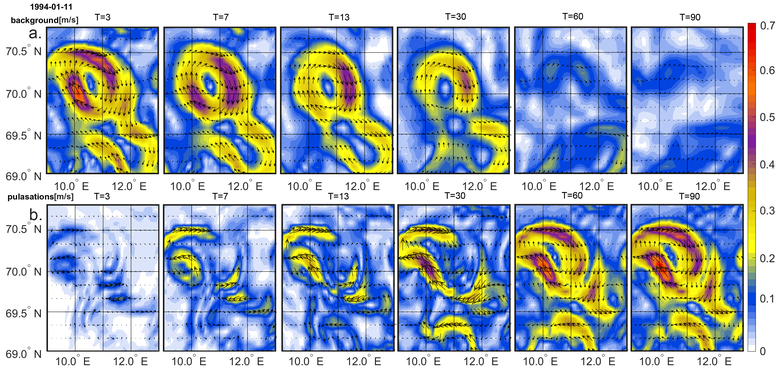
Figure 2. Background (top row) and pulsation (bottom row) flow velocities (m/s) with different averaging periods: $T = 3$, 7, 13, 15, 30, 60, 90 days (from left to right). The arrows show the direction and the color indicates the module of the flow rate.

![]()
Citation: Fedorov Aleksandr M., Tatyana V. Belonenko (2020), Interaction of mesoscale vortices in the Lofoten Basin based on the GLORYS database, Russ. J. Earth Sci., 20, ES2002, doi:10.2205/2020ES000694.
Copyright 2020 by the Geophysical Center RAS.
Generated from LaTeX source by ELXfinal, v.2.0 software package.