RUSSIAN JOURNAL OF EARTH SCIENCES, VOL. 20, ES1006, doi:10.2205/2019ES000688, 2020
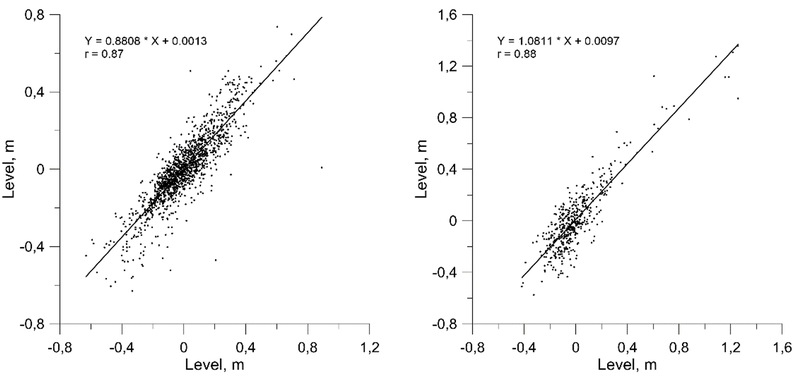
Figure 2. Sea level scatter diagram for 2009 (a) and 2015 (b) on Tuleniy.

![]()
Citation: Pavlova A. V., V. S. Arkhipkin, S. A. Myslenkov (2020), Storm surge modeling in the Caspian Sea using an unstructured grid, Russ. J. Earth Sci., 20, ES1006, doi:10.2205/2019ES000688.
Copyright 2020 by the Geophysical Center RAS.
Generated from LaTeX source by ELXfinal, v.2.0 software package.