RUSSIAN JOURNAL OF EARTH SCIENCES, VOL. 20, ES1001, doi:10.2205/2019ES000684, 2020
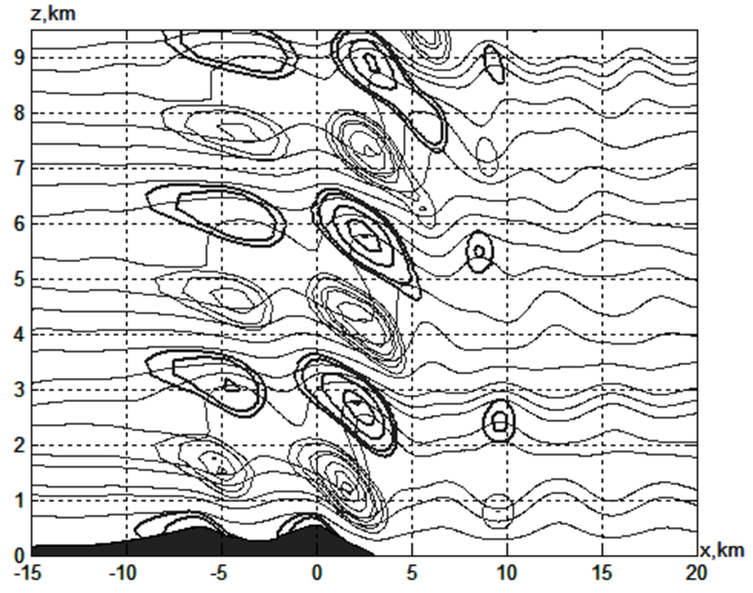
Figure 4. Disturbances for the same variant as in Figure 2, in more detail. $T'$ trajectories and isolines are presented with values given in the sets of $zVT_1 = - [1.2 \:1.5\: 2.2\: 2.8\: 3.1]$ and $zVT_2 = [1.3 \:1.6\: 2 \:2.2\: 2.6\: 3\: 3.2].$

![]()
Citation: Kozhevnikov V. N., R. B. Berzegova, M. K. Bedanokov (2020), Modeling of the Novorossiysk bora. Part 1. Atmospheric disturbances over the mountains of Novorossiysk, Russ. J. Earth Sci., 20, ES1001, doi:10.2205/2019ES000684.
Copyright 2020 by the Geophysical Center RAS.
Generated from LaTeX source by ELXfinal, v.2.0 software package.