RUSSIAN JOURNAL OF EARTH SCIENCES, VOL. 19, ES6005, doi:10.2205/2019ES000692, 2019
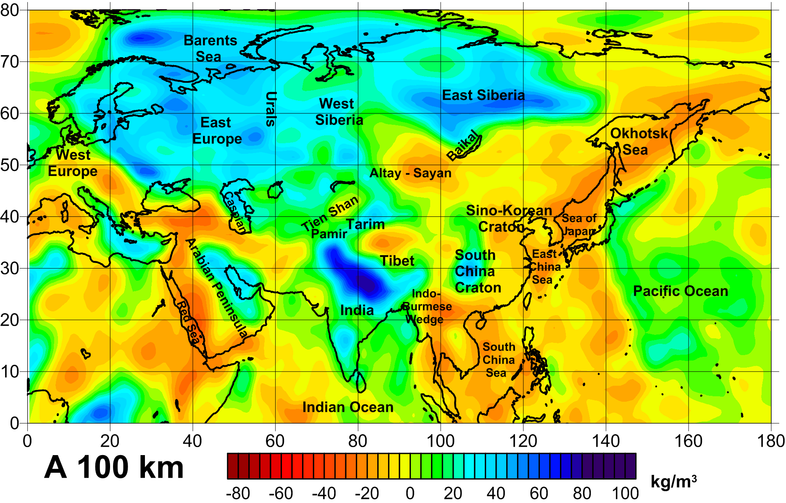
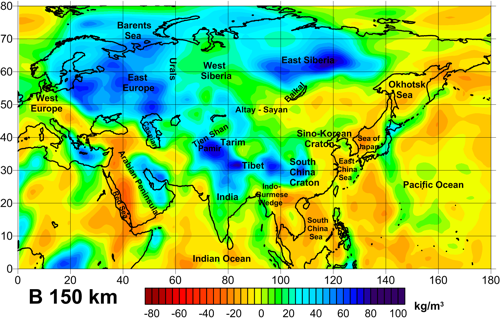
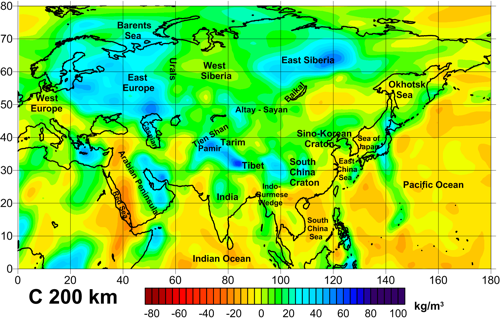
Figure 5. Initial density model of the uppermost mantle. Density variations are shown at depths of (A) 100 km, (B) 150 km, and (C) 200 km.

![]()
Citation: Kaban Mikhail K., Roman I. Krasnoperov, Anatoly A. Soloviev, Yulia I. Nikolova (2019), The integrative density model of the crust and upper mantle of Eurasia: representation in GIS environment, Russ. J. Earth Sci., 19, ES6005, doi:10.2205/2019ES000692.
Copyright 2019 by the Geophysical Center RAS.
Generated from LaTeX source by ELXfinal, v.2.0 software package.