RUSSIAN JOURNAL OF EARTH SCIENCES, VOL. 19, ES5005, doi:10.2205/2019ES000679, 2019
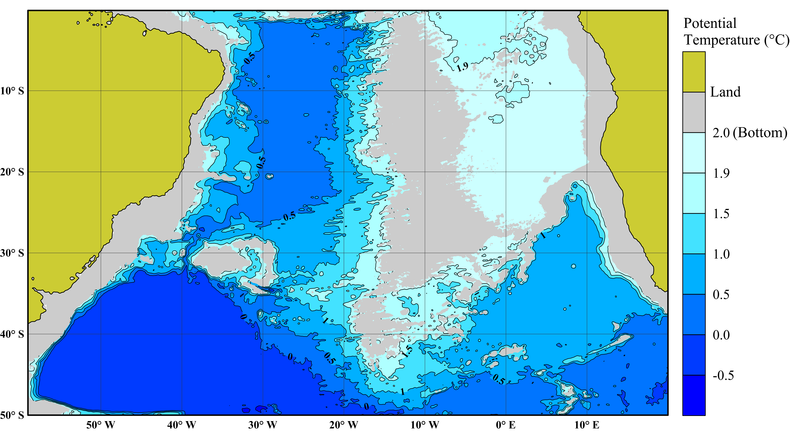
Figure 4. Bottom potential temperature in the bottom layer of the Atlantic. The data were taken from the deepest $\sigma$-level of the model. The ocean basins with bottom potential temperature greater than 2° C are shown with gray color.

![]()
Citation: Frey D. I., E. G. Morozov, I. Ansorge, V. V. Fomin, N. A. Diansky, R. Yu. Tarakanov (2019), Thermohaline structure of Antarctic Bottom Water in the abyssal basins of the South Atlantic, Russ. J. Earth Sci., 19, ES5005, doi:10.2205/2019ES000679.
Copyright 2019 by the Geophysical Center RAS.
Generated from LaTeX source by ELXfinal, v.2.0 software package.