RUSSIAN JOURNAL OF EARTH SCIENCES, VOL. 19, ES5005, doi:10.2205/2019ES000679, 2019
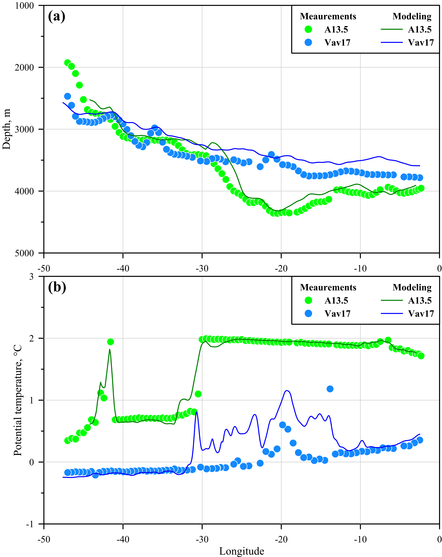
Figure 2. The data used for verification of the model: depth of 2° C potential temperature isotherm (a) and potential temperature at the ocean bottom (b) along the hydrographic sections in the West (shown with blue colors) and East (green colors) Atlantic. Circles indicate the values at the CTD-stations; solid lines are the data of numerical modeling interpolated to the trajectory of the sections. Some statistical parameters of these data are given in Table 1.

![]()
Citation: Frey D. I., E. G. Morozov, I. Ansorge, V. V. Fomin, N. A. Diansky, R. Yu. Tarakanov (2019), Thermohaline structure of Antarctic Bottom Water in the abyssal basins of the South Atlantic, Russ. J. Earth Sci., 19, ES5005, doi:10.2205/2019ES000679.
Copyright 2019 by the Geophysical Center RAS.
Generated from LaTeX source by ELXfinal, v.2.0 software package.