RUSSIAN JOURNAL OF EARTH SCIENCES, VOL. 19, ES5004, doi:10.2205/2019ES000676, 2019
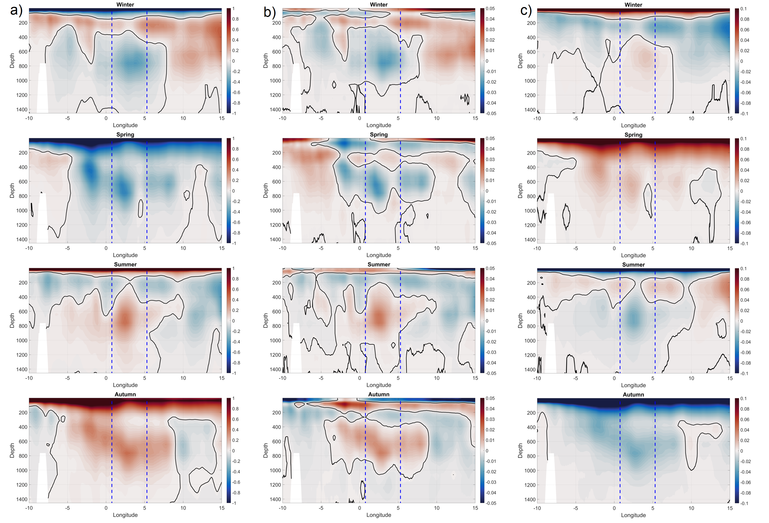
Figure 3. Zonal vertical cross-sections of temperature (° C) (a), salinity (b), and potential density (kg m$^{-3}$) (c) anomalies along the 69.8° N in different seasons for 1993–2017. The black lines show zero values. The blue dashed lines indicate the area of the LV.

![]()
Citation: Travkin V. S., T. V. Belonenko (2019), Seasonal variability of mesoscale eddies of the Lofoten Basin using satellite and model data, Russ. J. Earth Sci., 19, ES5004, doi:10.2205/2019ES000676.
Copyright 2019 by the Geophysical Center RAS.
Generated from LaTeX source by ELXfinal, v.2.0 software package.