RUSSIAN JOURNAL OF EARTH SCIENCES, VOL. 19, ES5003, doi:10.2205/2019ES000675, 2019
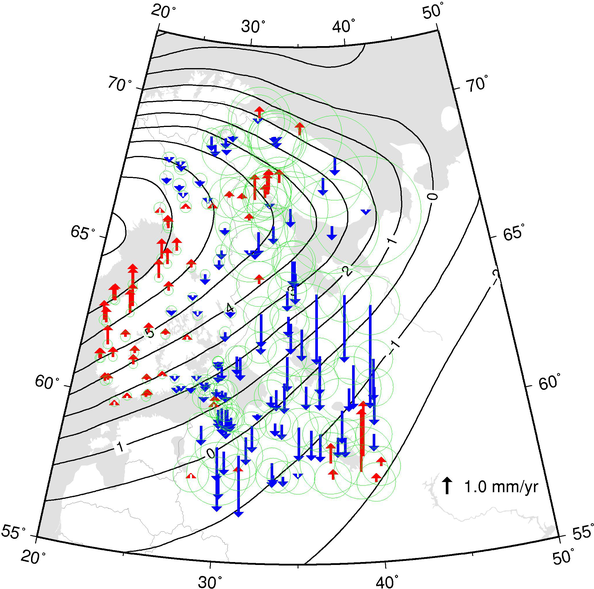
Figure 4. The arrows give the residuals of our result w.r.t. the model of Glacial Isostatic Adjustment (GIA) by Lambeck et al. [1998]. The isolines were digitized from the paper. The $-2$ mm/year isoline is our own extrapolation Most of our TG rates were used in the construction of the GIA model. The green circles show our formal 1-sigma error estimates.

![]()
Citation: Kaftan Vladimir, Jaakko Mäkinen (2019), Fennoscandian uplift study as an example of Russian-Finnish cooperation in Arctic geodesy (Advisory), Russ. J. Earth Sci., 19, ES5003, doi:10.2205/2019ES000675.
Copyright 2019 by the Geophysical Center RAS.
Generated from LaTeX source by ELXfinal, v.2.0 software package.