RUSSIAN JOURNAL OF EARTH SCIENCES, VOL. 19, ES2002, doi:10.2205/2019ES000659, 2019
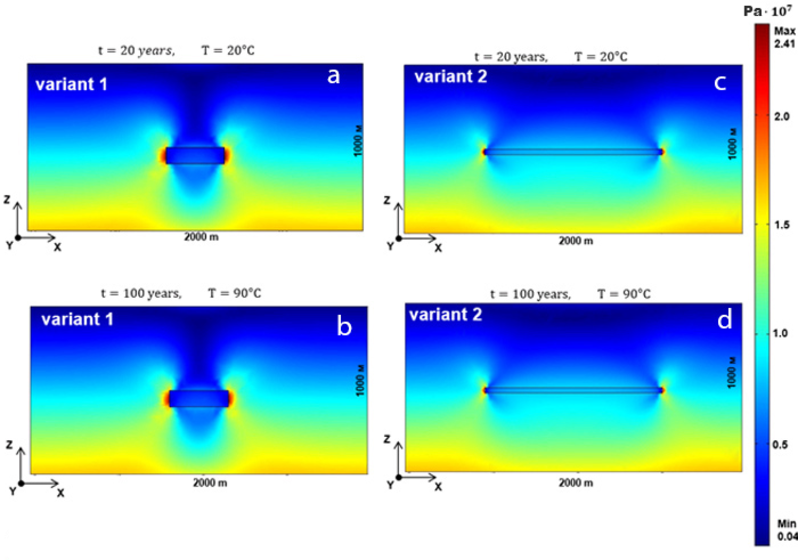
Figure 4. Stress intensity distribution $\sigma_i$ excluding tectonic stresses: a – variant I, heat time = 20 years, $T_\text{DGR}$ = 20$^\circ$ C ; b – variant I, heat time = 100 years, $T_\text{DGR}$ = 90$^\circ$ C; c – variant II, heat time = 20 years, $T_\text{DGR}$ = 20$^\circ$ C; d – variant II, heat time = 100 years, $T_\text{DGR}$ = 90$^\circ$ C.

![]()
Citation: Tatarinov V. N., V. N. Morozov, A. S. Batugin (2019), An underground research laboratory: new opportunities in the study of the stress-strain state and dynamics of rock mass destruction, Russ. J. Earth Sci., 19, ES2002, doi:10.2205/2019ES000659.
Copyright 2019 by the Geophysical Center RAS.
Generated from LaTeX source by ELXpaper, v.2.0 software package.