RUSSIAN JOURNAL OF EARTH SCIENCES, VOL. 19, ES3001, doi:10.2205/2019ES000657, 2019
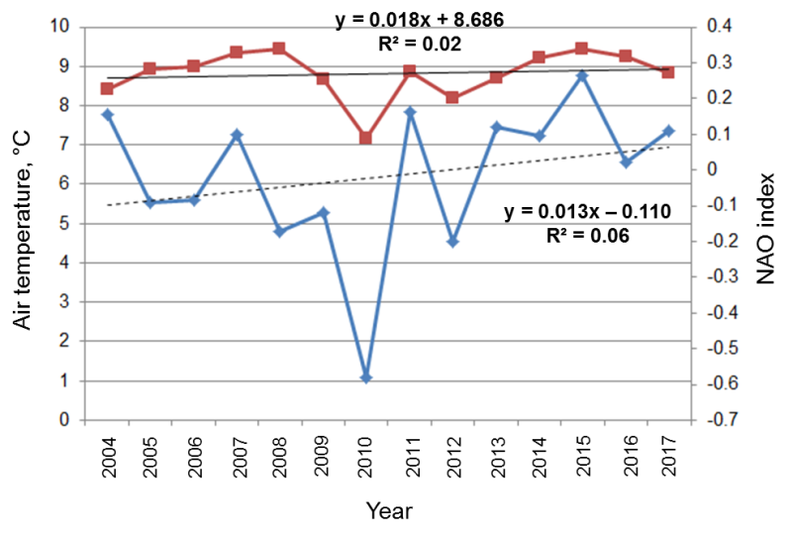
Figure 3. Interannual variations of air temperature and NAO indices. The red line shows the air temperature distribution, the blue line – the NAO index. The linear trend of air temperature is shown with a solid line, the linear trend of the NAO index – dotted line.

![]()
Citation: Stont Z. I., T. V. Bukanova (2019), General features of air temperature over coastal waters of the south-eastern Baltic Sea for 2004–2017, Russ. J. Earth Sci., 19, ES3001, doi:10.2205/2019ES000657.
Copyright 2019 by the Geophysical Center RAS.
Generated from LaTeX source by ELXpaper, v.2.0 software package.