RUSSIAN JOURNAL OF EARTH SCIENCES, VOL. 19, ES2002, doi:10.2205/2019ES000656, 2019
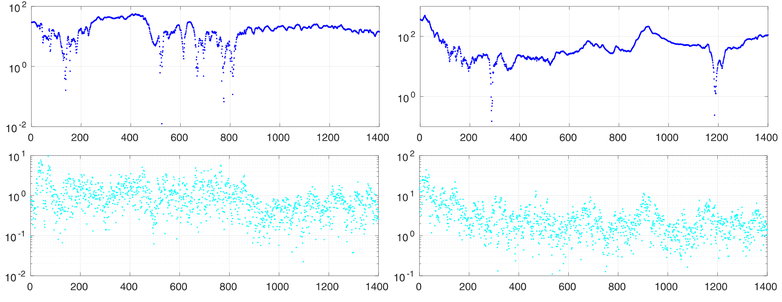
Figure 4. Horizontal axes show the sequential number of the selected magnetic data, vertical axe show the intensity in nT. Left: intensity $\lvert{\mathbf{B}}-\bar{{\mathbf{B}}}\rvert$ in nT, $\bar{{\mathbf{B}}}$ is the mean field (top plot) and corresponding absolute values of variations $\lvert{\mathbf{b}}\rvert$ (bottom plot) for the KIV data; right: the similar plots for the SPG data.

![]()
Citation: Khokhlov A., R. Krasnoperov, B. Nikolov, J. Nikolova, M. Dobrovolsky, V. Petrov, D. Kudin, I. Belov (2019), On the directions and structure of the short-term magnetic variations, Russ. J. Earth Sci., 19, ES2002, doi:10.2205/2019ES000656.
Copyright 2019 by the Geophysical Center RAS.
Generated from LaTeX source by ELXpaper, v.2.0 software package.