RUSSIAN JOURNAL OF EARTH SCIENCES, VOL. 19, ES1005, doi:10.2205/2019ES000650, 2019
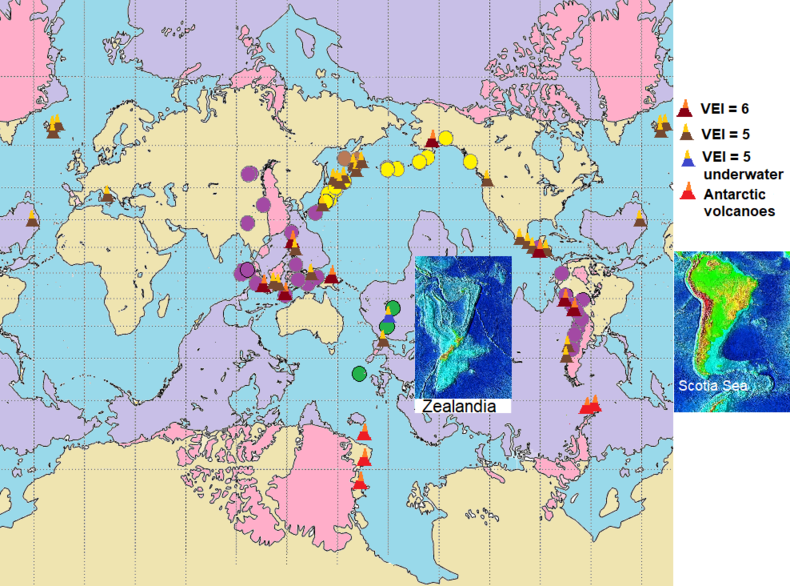
Figure 2. Seismic activity on the map of antipodes in Mercator projection. The land antipodal to water is shown in light sandy color, water antipodal to land is shown in light purple, land antipodal to land is shown in pink, water antipodal to water is shown in blue. Magnitude $\geqslant 8.2$ earthquakes in 1900–2017, according to, are shown by circles. Known VEI $\geqslant 5$ eruptions and five known Antarctic eruptions in 1892–2018 are shown by the symbols of volcanoes.

![]()
Citation: Kovalyov Mikhail (2019), On the correlation of seismic activity to syzygies., Russ. J. Earth Sci., 19, ES1005, doi:10.2205/2019ES000650.
Copyright 2019 by the Geophysical Center RAS.
Generated from LaTeX source by ELXpaper, v.2.0 software package.