RUSSIAN JOURNAL OF EARTH SCIENCES, VOL. 19, ES1003, doi:10.2205/2018ES000644, 2019
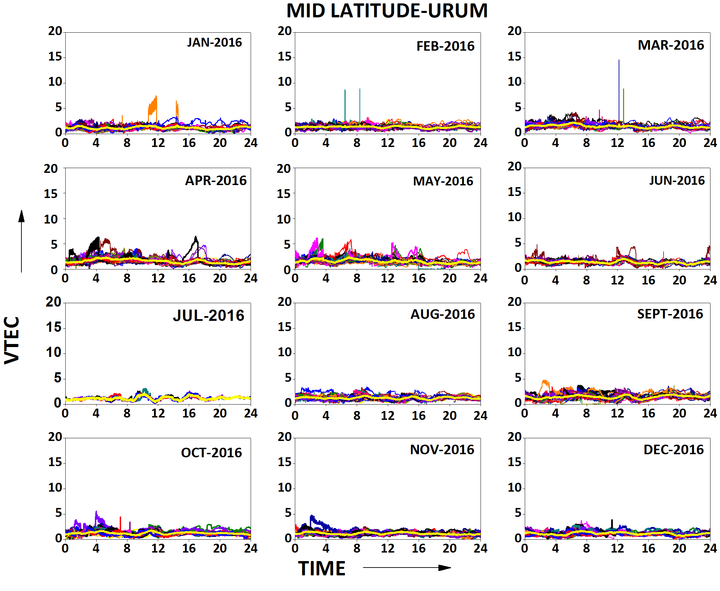
Figure 2. The diurnal variability of the TEC during all the months of the year 2016 at URUM. UT is considered for time.

![]()
Citation: Parwani Mahesh, Roshni Atulkar, Shweta Mukherjee, P. K. Purohit (2019), Latitudinal variation of ionospheric TEC at Northern Hemispheric region, Russ. J. Earth Sci., 19, ES1003, doi:10.2205/2018ES000644.
Copyright 2019 by the Geophysical Center RAS.
Generated from LaTeX source by ELXpaper, v.2.0 software package.