RUSSIAN JOURNAL OF EARTH SCIENCES, VOL. 18, ES6006, doi:10.2205/2018ES000646, 2018
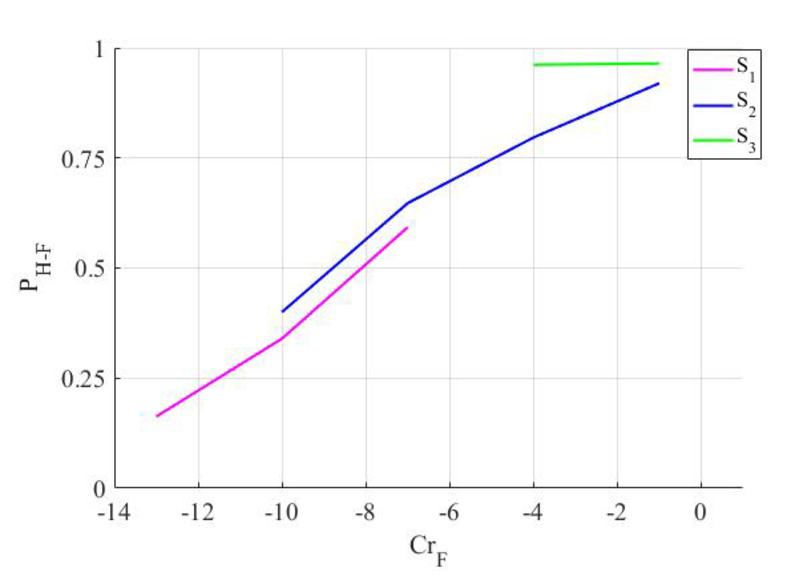
Figure 10. Ratio of number of F method detected to visually detected Pc3 intervals in dependence of CrF parameter for three groups of $S_0$, with group mean value of PSD $S_1< S_2< S_3$.

![]()
Citation: Bogoutdinov Sh. R., N. V. Yagova, V. A. Pilipenko, S. M. Agayan (2018), A technique for detection of ULF Pc3 waves and their statistical analysis, Russ. J. Earth Sci., 18, ES6006, doi:10.2205/2018ES000646.
Copyright 2018 by the Geophysical Center RAS.
Generated from LaTeX source by ELXpaper, v.1.5 software package.