RUSSIAN JOURNAL OF EARTH SCIENCES, VOL. 18, ES6006, doi:10.2205/2018ES000646, 2018
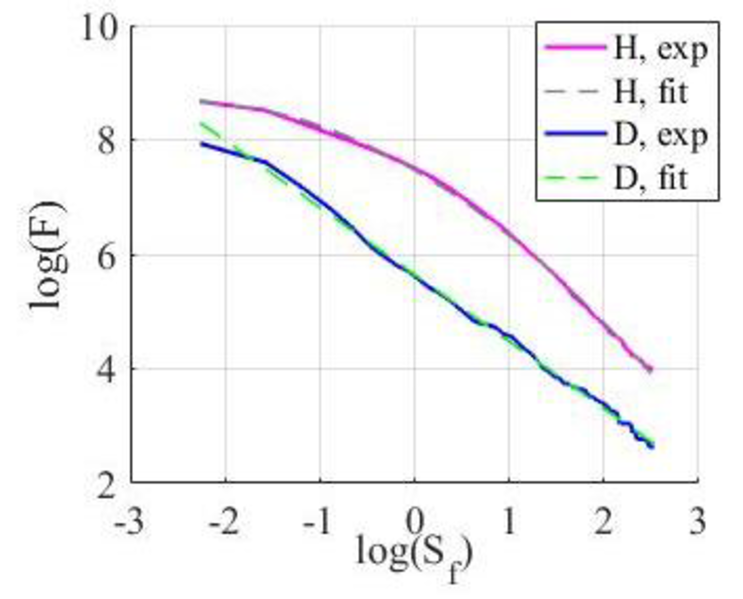
Figure 8. Integral probability function $F(S)$ ($S$ is the Pc3 spectral power density). Dashed lines denote the linear (for $D$ component) and parabolic (for $H$ component) approximations of $F(S)$ dependences.

![]()
Citation: Bogoutdinov Sh. R., N. V. Yagova, V. A. Pilipenko, S. M. Agayan (2018), A technique for detection of ULF Pc3 waves and their statistical analysis, Russ. J. Earth Sci., 18, ES6006, doi:10.2205/2018ES000646.
Copyright 2018 by the Geophysical Center RAS.
Generated from LaTeX source by ELXpaper, v.1.5 software package.