RUSSIAN JOURNAL OF EARTH SCIENCES, VOL. 17, ES4004, doi:10.2205/2017ES000608, 2017

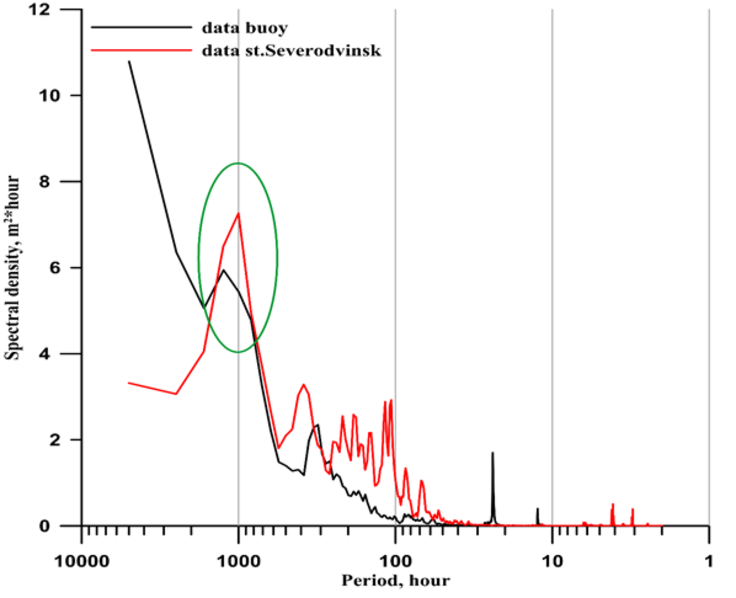
Figure 2. Variations in spectral density (m$^2$ h) according to the hourly level (m) data of the Vardø buoy in 2014 and Severodvinsk station in 2013. (The ellipse separates the peak of the spectral density at a period of $\sim 40$ days).
Citation: Korablina A. D., A. T. Kondrin, V. S. Arkhipkin (2017), Numerical simulations and statistics of surges in the White and Barents seas, Russ. J. Earth Sci., 17, ES4004, doi:10.2205/2017ES000608.
Copyright 2017 by the Geophysical Center RAS.
Generated from LaTeX source by ELXpaper, v.1.5 software package.

