RUSSIAN JOURNAL OF EARTH SCIENCES, VOL. 17, ES4003, doi:10.2205/2017ES000606, 2017
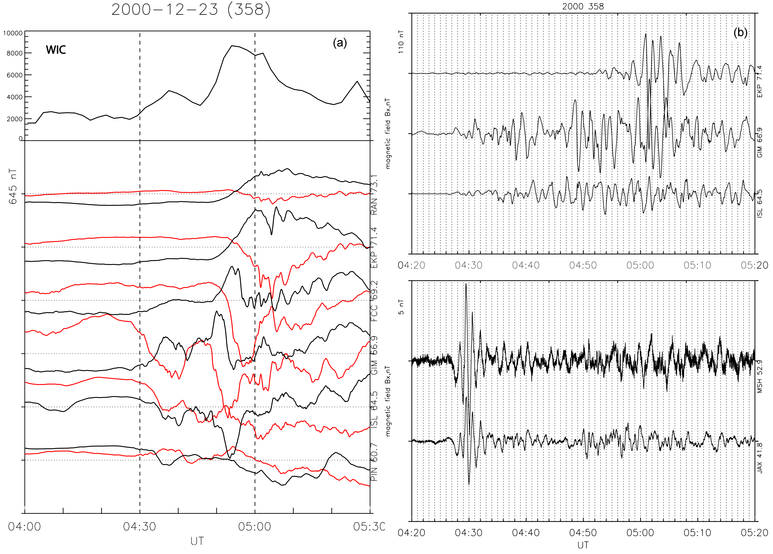
Figure 3. Left top panel: Time evolution of UV WIC intensity from IMAGE spacecraft (integrated over the latitudinal range $\Delta \Phi=60.7\mbox{°} -73.1\mbox{°})$ above the geomagnetic meridian 330°. Left bottom panel: magnetograms of $X$ component (red line) and $Z$ component (black line) geomagnetic field variations along the latitudinal profile $\sim 330\mbox{°}$ on 12/23, 2000 (day 358) 0400–0530 UT. CGM latitudes are indicated near station codes. The scale between ticks is shown near left-hand axis. Right top panel: Magnetograms of $X$ component geomagnetic field variations from the high-latitude CARISMA/MACCS stations. Right bottom panel: Mid-latitude MEASURE stations on 12/23, 2000 (day 358) 0415–0445 UT. CGM latitudes are indicated near station codes.

![]()
Citation: Martines-Bedenko V. A., V. A. Pilipenko, M. J. Engebretson, M. B. Moldwin (2017), Time-spatial correspondence between Pi2 wave power and ultra-violet aurora bursts, Russ. J. Earth Sci., 17, ES4003, doi:10.2205/2017ES000606.
Copyright 2017 by the Geophysical Center RAS.
Generated from LaTeX source by ELXpaper, v.1.5 software package.