RUSSIAN JOURNAL OF EARTH SCIENCES, VOL. 17, ES3001, doi:10.2205/2017ES000599, 2017
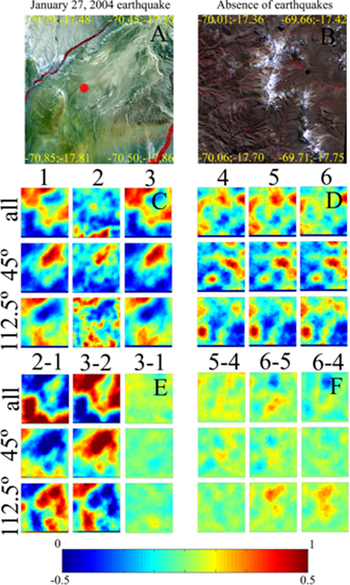
Figure 10. Pseudocolor ASTER images of (A) area of January 27, 2004 earthquake and (B) area without seismic activity. Densities of strokes at threshold 0 for all orientations and for orientations in the lines of 45° and 112.5° obtained based on the images of the seismically active area (1) 128 days and (2) 48 days before the earthquake and (3) 73 days after the earthquake, as well as based on the image (D) of the aseismic area. Differences between the densities of strokes in the (E) seismically active and (F) aseismic areas.

![]()
Citation: Zakharov V. N., A. V. Zverev, A. T. Zverev, V. A. Malinnikov, O. N. Malinnikova (2017), Application of automated lineament analysis of satellite images in modern geodynamics research: A case study, Russ. J. Earth Sci., 17, ES3001, doi:10.2205/2017ES000599.
Copyright 2017 by the Geophysical Center RAS.
Generated from LaTeX source by ELXpaper, v.1.5 software package.