RUSSIAN JOURNAL OF EARTH SCIENCES, VOL. 16, ES6007, doi:10.2205/2016ES000593, 2016
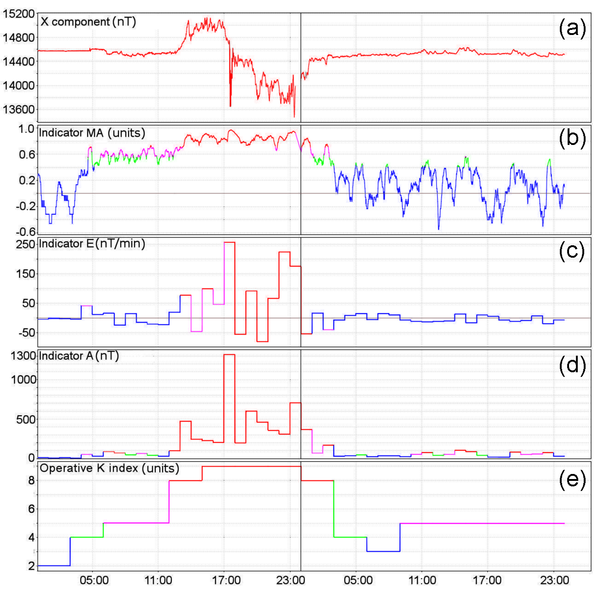
Figure 3. Data from the SPG observatory for the period of March 17–18, 2015: the actually observed geomagnetic $X$ component (a), parameter of anomalousness $MA$ (b), rate of disturbances $E$ (c), amplitude disturbances $A$ (d), and operational $K$ index (e). the background, marginally anomalous, mildly anomalous and strongly anomalous level is shown in blue, green, purple and red, respectively.

![]()
Citation: Gvishiani A. D., R. V. Sidorov, R. Yu. Lukianova, A. A. Soloviev (2016), Geomagnetic activity during St. Patrick's Day storm inferred from global and local indicators, Russ. J. Earth Sci., 16, ES6007, doi:10.2205/2016ES000593.
Copyright 2016 by the Geophysical Center RAS.
Generated from LaTeX source by ELXpaper, v.1.5 software package.