RUSSIAN JOURNAL OF EARTH SCIENCES, VOL. 16, ES6006, doi:10.2205/2016ES000589, 2016
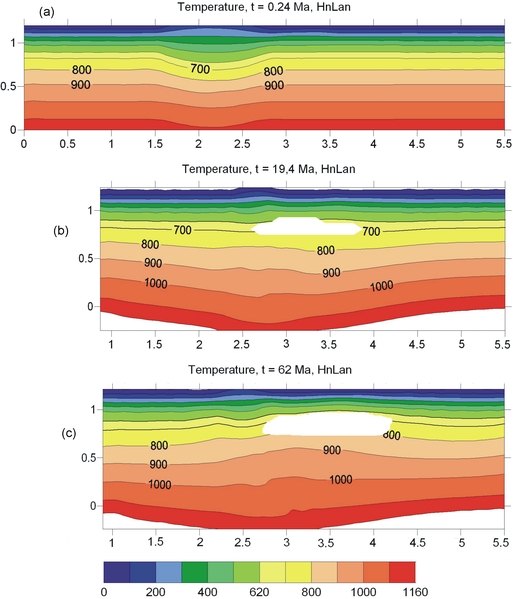
Figure 4. Temperature distribution for "normal" crust at: (a) – the beginning of deformation process, (b) – the end of collision process with a rate of 0.5 cm/yr and (c) – postcollision stage. Heat generation rate ($H_n$) is 2.0 $\mu$W/m$^3$, thermal conductivity $\lambda$ ($La_n$) = 2.5 W/m K for the upper crust. Horizontal and vertical scales $1=100$ km. Blanked areas show approximate position of partial melting zone for "wet granite solidus" [Perchuk, 1973].

![]()
Citation: Parphenuk O. I. (2016), Thermal regime and heat transfer during the evolution of continental collision structures, Russ. J. Earth Sci., 16, ES6006, doi:10.2205/2016ES000589.
Copyright 2016 by the Geophysical Center RAS.
Generated from LaTeX source by ELXpaper, v.1.5 software package.