RUSSIAN JOURNAL OF EARTH SCIENCES, VOL. 16, ES3003, doi:10.2205/2016ES000573, 2016
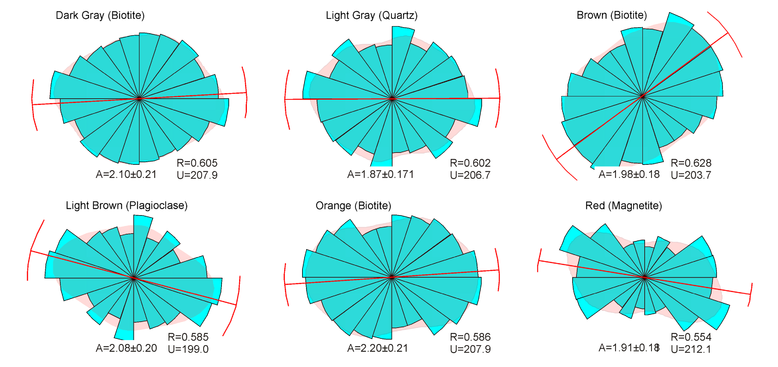
Figure 7. Rose diagrams illustrating the ODF of different mineral fractions based on the analysis of photographic images reproduced in Figure 3. The numerical values of the Rayleigh $R$ and Rao's $U$ parameter are reproduced too, which sustain the hypothesis of a non-uniform, anisotropic distribution of mineral components.

![]()
Citation: Duliu Octavian G., Tatiana I. Ivankina, Edward Herman, Calin Ricman, Ion Tiseanu (2016), Orientation distribution function of biotite platelets based on optical, thin sections and $\mu$-CT image analysis in an Outokumpu (Finland) biotite gneiss: Comparison with neutron diffraction texture analysis, Russ. J. Earth Sci., 16, ES3003, doi:10.2205/2016ES000573.
Copyright 2016 by the Geophysical Center RAS.
Generated from LaTeX source by ELXpaper, v.1.5 software package.