RUSSIAN JOURNAL OF EARTH SCIENCES, VOL. 16, ES3003, doi:10.2205/2016ES000573, 2016
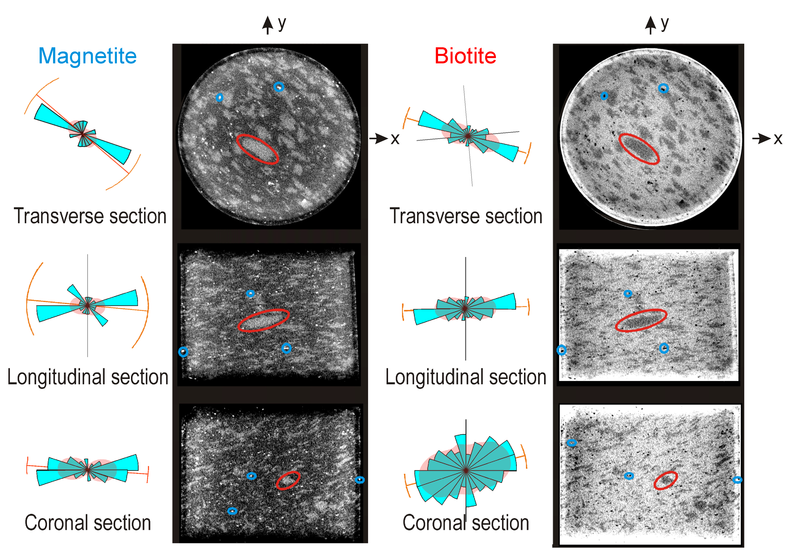
Figure 4. Three $\mu$-CT images of the biotite gneiss sample OKU 1844 corresponding to three mutually perpendicular sections, according to the coordinate system illustrated in Figure 2. For a better illustration, both negative and positive CT images are reproduced. The rose diagrams illustrate the SPO of biotite and magnetite grains. The average value $\pm$ standard deviation of the corresponding ODF are graphically represented here and in Figure 6 and Figure 7 by red lines.

![]()
Citation: Duliu Octavian G., Tatiana I. Ivankina, Edward Herman, Calin Ricman, Ion Tiseanu (2016), Orientation distribution function of biotite platelets based on optical, thin sections and $\mu$-CT image analysis in an Outokumpu (Finland) biotite gneiss: Comparison with neutron diffraction texture analysis, Russ. J. Earth Sci., 16, ES3003, doi:10.2205/2016ES000573.
Copyright 2016 by the Geophysical Center RAS.
Generated from LaTeX source by ELXpaper, v.1.5 software package.