RUSSIAN JOURNAL OF EARTH SCIENCES, VOL. 15, ES1003, doi:10.2205/2015ES000547, 2015
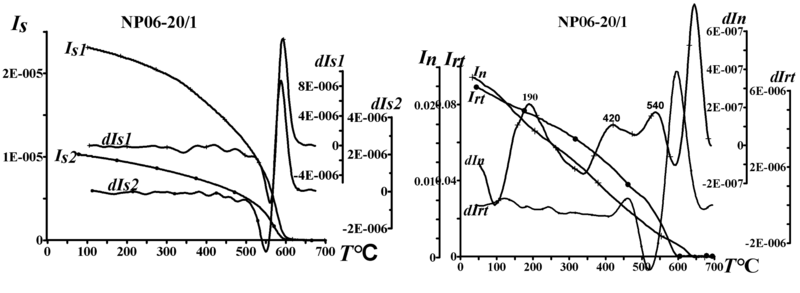
Figure 1. Thermomagnetic curves showing the temperature dependencies of saturation magnetization (left-hand plots). $I_{s1}$ and $I_{s2}$ are the first and second heating, respectively. $I_{n}$ is the thermomagnetic curves of natural remanent magnetization. $I_{rt}$ is the thermomagnetic curves of thermal remanent magnetization (right-hand plots). For each curve, curves of its second derivative are shown, and the temperatures of kinks on the curves of natural remanent magnetization are presented. The values of $I_{s}$, $I_{n}$, and $I_{rt}$ are in $10^3$ A/m.
To view other samples click on the corresponding number below:
[NP06-20/1] [NP06-51/2] [NP06-32/1] [NP06-26/2] [NP06-54/2] [NP06-43/4] [NP06-54/3]
[NP06-57/2] [NP06-20/2] [NP06-23/3] [NP06-46/2] [NP06-49/2] [NP06-53/2]

![]()
Citation: Popov K. V., B. A. Bazylev, V. P. Shcherbakov, V. A. Tsel'movich, N. N. Kononkova (2015), Thermomagnetic analysis of ultramafic rocks: A case study of dunite from the Pekul'ney Complex, Chukotka, NE Russia, Russ. J. Earth Sci., 15, ES1003, doi:10.2205/2015ES000547.
Copyright 2015 by the Geophysical Center RAS.
Generated from LaTeX source by ELXpaper, v.1.3 software package.