 (-20 %)
at the polar stations) and accompanied by geomagnetic disturbances with
Dst
  -300 nT.
V. M. Dvornikov and V. E. Sdobnov
Institute of Solar-Terrestrial Physics, Irkutsk, Russia
Received 12 March 2001, published online 25 November 2001
The problem of determining variations of the cosmic-ray CR distribution function outside the confines of the magnetosphere from ground-based observations presents considerable difficulty, and to solve it requires physically adequate assumptions about the form of the distribution function. All techniques available to date [Baisultanova et al., 1987, 1991; Dvornikov et al., 1983; Krymskiy et al., 1966; Nagashima, 1971; Shea and Smart, 1982] take advantage of the assumptions either about the isotropic character of the CR distribution function or about the total separation of angular and energy variables, or about the separation of these variables for each spherical harmonic by expanding the distribution function in terms of spherical harmonics. In addition, the form of the rigidity dependence of the anisotropy is considered independent of time and is specified on the basis of some model for the propagation of particles in interplanetary space. This paper uses the technique (the method of spectrographic global survey (SGS)), the description of which is given in the section 2.
Using this technique,
we investigate a giant Forbush decrease of
13-25
July
1982, characterized by significant CR modulation amplitudes
(
 (-20 %)
at the polar stations) and accompanied by geomagnetic disturbances with
Dst
  -300 nT.
Our method is based on the assumption that the anisotropy in the CR distribution along the directions of the arrival is attributed to a dependence of their intensity on the pitch angle in the interplanetary magnetic field (IMF) and to a density gradient at the Larmor radius of particles.
In line with this assumption we will choose two orthogonal axes, one
directed parallel (or antiparallel) to the IMF vector and the other directed
to the vector
B 
 n
n ,
where
B is
the IMF vector and
 n
n is the CR density gradient
component transverse with respect to
B . We now introduce a
geocentric ecliptic coordinate system with the sunward directed axis
OX.
The
angle between the particle velocity vector
V and
B (pitch
angle) can then be defined by the expression
 | (1) |
and the angle between
V and
B 
 n
n is represented by
 | (2) |
Here the angles Y0 and l0 characterize the orientation of the first axis, and f0 and x0 stand for the orientation of the second axis in our chosen coordinate system. The direction of motion of a particle is determined by the angles Y and l.
In this case, from the orthogonality condition for the chosen axes, the angle x0 can be expressed in terms of the angles Y0, l0, and f0,
 | (3) |
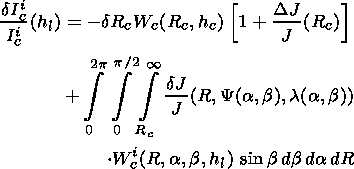
The CR intensity variation amplitudes observed on the ground may be represented by an expression of form [Dorman, 1957]
 | (4) |
Here dIci/Ici(hli) stands for variation amplitudes of an integral flux of secondary particles of sort i (with respect to a certain background level Ici ) observed at a geographical site c at level hl in the Earth's atmosphere; a and b are the azimuthal and zenith angles of arrival of primary particles at the atmospheric boundary; Rc is effective rigidity of geomagnetic cutoff; Wci(R, a, b, hl) is the coupling function between primary and secondary CR variations; and Yc(R, a, b) and lc(R,a, b) are the asymptotic angles of arrival of particles; dRc(Rc) is a probable variation in geomagnetic cutoff rigidity Rc. According to Dvornikov and Sdobnov [1991], dependence of dRc on Rc was approximated by relations of the form
 |
are the amplitudes of CR global intensity variations at the threshold rigidity Rc.
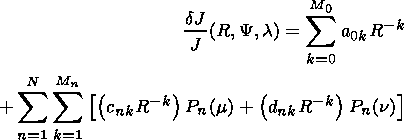
Next, it will be assumed that flux density variations of primary CR particles are represented by
 | (5) |
where Pn(m) and Pn(n) are the Legendre polynomials.
As follows from (5), the CR angular distribution are represented by two axially symmetric (with respect to the corresponding axis) anisotropy components, each of which has its own rigidity dependence. Rigidity spectra of the anisotropic component and of two anisotropy components are approximated rows from the inverse degree of rigidity.
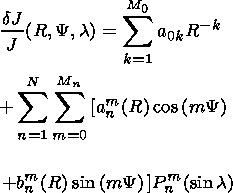
In the solar-ecliptic coordinate system, expression (5) will be of the form
 | (6) |
where
 |
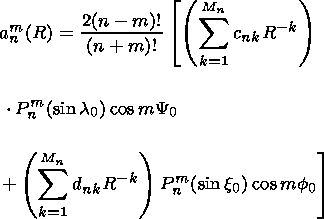 | (7) |
 |
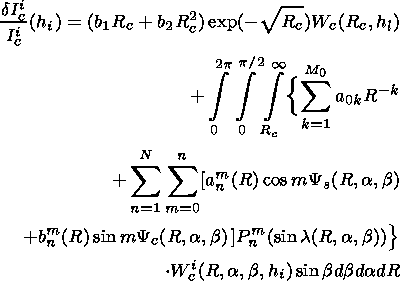
Upon substituting expression (6) into the equation of variations (4), we obtain the following system of nonlinear algebraic equations:
 | (8) |
If in (6) and (7) we confine ourselves to two spherical harmonics to describe each of the anisotropy components ( N=2 ) and if we set M0=3 and M1=M2=2, then the problem is reduced to a search for the following unknown parameters: b1, b2, a01, a02, a03, c11, c12, c21, c22, d11, d12, which characterize variations of geomagnetic cutoff rigidity Rc, differential rigidity variation spectra of the isotropic component and two components of the first and second harmonics of the CR angular distribution; Y0, l0, x0, and f0 determine the orientation of the chosen symmetry axes.
To solve the above formulated problem, the world stations network and detector systems there must ensure redundancy and linear independence of the system of equations (8). In solving the problem the angles Y0, l0, and f0 are subjected to the Monte Carlo method, and the angle x0 is inferred from formula (3). Upon substituting values of the "played" angles into system (8), we obtain a system of linear equations that is solved by the least squares technique.
Values obtained for the roots of the system of equations (8) are used to calculate the amplitude A1(R) and the phase Y1(R), l1(R) of the first spherical harmonic for particles with rigidity R by the formulas
 | (9) |
as well as amplitudes and phases of the zonal ( m=0 ), tesseral ( m n ), and sectorial ( m=n ) components of the second and the third harmonic:
 | (10) |
where anm(R) and bnm(R) are defined by expression (7).
As follows from (9) and (10), unlike all existing techniques, in the proposed method the form of rigidity dependencies of the anisotropy is determined for each instant of time, while phases of the first, tesseral, and sectorial components of the second harmonic depend on particle rigidity. When developing the method, we used more than 10 representations of the CR distribution function that reflect different models for the propagation of particles in the heliosphere, but the best agreement with ground-based and satellite measurements in analyzing the phenomenon under investigation was obtained for a distribution function of the form (5). Calculations were based on coupling functions between primary and secondary CR reported [Lockwood and Webber, 1967; Webber, 1962; Webber and Quenby, 1959] (corrected for an 11-year variation) and on asymptotic angles obtained through trajectory calculations [McCracken et al., 1965; Shea et al., 1965] as well as formulas for transition to the chosen coordinate system [Dorman, 1975].
The analysis used data from the worldwide network of neutron monitor stations corrected for pressure and averaged for 2-hour time intervals [World Data Center C2]. Modulation amplitudes were measured from the background level of July 9. The data were from 42 neutron monitors, which are listed in Table 1.

|
| Figure 1 |

|
| Figure 2 |

|
| Figure 3 |
Figure 3 (left and right, respectively) shows the dependencies of variations in geomagnetic cutoff rigidity DRc on the geomagnetic cutoff rigidity Rc obtained from the analysis, and the results of calculations of DRc(Rc) [Dorman and Tyasto, 1965; Treiman, 1953] for the model of the magnetospheric current flowing in a westward direction along the parallels on a sphere with the force proportional to the latitude cosine [Chapman, 1937].
A maximum modulation amplitude for particles with
R = 4 and 20 GV was
observed on July 14 to make up
 -40 % and
 -20 %,
respectively. The variations show a very hard spectrum (the spectral index
of the variations
g
 0.4 ).
A maximum anisotropy amplitude was
observed at the period of a maximum modulation on
14 and 15
July
with
A1
  25 %, and
A12 and
A22
  5 % for particles with
R = 4 GV.

|
| Figure 4 |

|
| Figure 5 |
CRs penetrate into the magnetic trap and escape it through centrifugal and gradient drifts of particles, and the increase in intensity is due to a change in the energy of CR as they travel in regular electromagnetic fields of the heliosphere.
The energy variation of particles D E as they travel in the regular electromagnetic fields E and B can be estimated within the drift approximation by solving the system of equations [Morozov and Soloviev, 1963]
 | (11) |
 | (12) |
 | (13) |
Here
v and
v
and
v are the velocity components of a particle
with the mass
m and charge
e parallel and perpendicular to the magnetic
field
B;
c is the velocity of light;
d r/dt is the
velocity of the center of the Larmor circle;
E=(m0 c2)/(1-v2/c2)1/2
is the averaged energy; and
J
 =
(m2v2
 )/(m02 B)
is the transverse adiabatic invariant.
The first term in equation (11) describes the motion of the particle along a magnetic field line, and the next three terms describe, the energy and the centrifugal and gradient drifts,
If rot
E= - (1/c) (
( B)(
B)( t) =0, and
 | (14) |
where U is the solar wind velocity, and the magnetic field, according to Parker [1963] have a radial and azimuthal component of the form
 | (15) |
where r is the radial distance from the Sun, l is the heliolatitude, and W is the angular rotation velocity of the Sun; then by integrating (12), in view of (11), and (13)-(15) we obtain the expression for the energy variation of particles D E in fields of the geometry under consideration [Dvornikov and Matyukhin, 1976; Dvornikov et al., 1987]
 | (16) |
Expression (16) shows how much the particle energy will decrease if it has travelled from the pole to the helioequator in a direction opposite to the electric field E (equation (14)).
The value of
D E, with the IMF modulus
 5 nT at the
Earth's orbit, is
 200 MeV and is independent either of the hardness
of particles or of their pitch angle in the IMF because the electric field
respectively.
in (14) of a stationary, homogeneous SW is a potential one. Nor does this
quantity depend on the SW velocity as the azimuthal IMF component in this
case is inversely proportional to the SW velocity (15)
 | (17) |
In the case where a loop-like structure of a high-speed solar wind is transported into interplanetary space, the situation reverses drastically. The electric field can have both a meridional, El, and an azimuthal, Ej, component. The strength of this field depends on the value of (Bj2 + Bl2)1/2 and on the SW velocity and can exceed by more than an order of magnitude, the magnitude of the electric field caused by the IMF of a helical geometry. Accordingly, there will be an increase in energy losses DEpt.
The variation in particle energy caused by the vortical component of the electric field (the second term on the right-hand side of equation (12)) is defined by the expression
 | (18) |
where
b (B/B0),
B0 and
B are the strengths of the
background magnetic field and of the variable field, respectively, and
e is the rest energy.
Besides, Dvornikov and Sdobnov [1997a, 1997b] conjectured that polarization electric fields exist in the heliosphere, which are produced at the propagation of accelerated particles in inhomogeneous fields of the heliosphere.
If the perpendicular (to the magnetic field) component of the polarization
electric field
Epl 
 (v/c)B, and
Epl
 (v/c)B, then equation (11) becomes
 | (19) |
and the energy
E in equation (12) is defined by the expression
E=(m/2)( v2+v 2+vE2);
u=v( B/B)+ vE;
vE=(c/B2) E
 B.
B.
The second terms on the right-hand side of equation (19) is integrated as a
drift under the action of the inertial force
m [ ( u/
u/ t)+ ( u
  )
u]
)
u]
In this case, the variation in particle energy under the action of the electric field Epl, provided that Epl is a linear function of time, is represented as
 | (20) |
where a = Epl2 / B2.
Polarization electric fields can be produced in the case of large-particle density gradients and a strong inhomogeneity of the magnetic field. Large-particle density gradients can arise in coronal loop-like structures of magnetic field when the magnetic field strength of these structures increases with time. In this case, cosmic rays are drifting toward the axis of the current system, which forms a loop-like structure, and are accelerated by the betatron mechanism; that is, the energy accumulation process is taking place.
Once critical values of the current are attained, the current system can be disrupted, which is accompanied by an explosive process and hence by an enhancement of the magnetic field inhomogeneity, i.e., by the production of conditions for the generation of Epl. In loop-like structures, a particle is accelerated up to rigidities R0, at which the Larmor radius of particles is comparable with the typical size of the acceleration regions.
If it is assumed that the energy variation of particles with R > R0 in inverse proportion to R, then in the general case, in the presence of the potential, vortical, and polarization components of the electric field, the expression for D E becomes
 | (21) |
Thus a particle with the energy E, recorded at the Earth's orbit at time ti, has had the energy E+D Ei outside the heliosphere, and the differential rigidity spectrum of the recorded particles, by Liouville's theorem, will be described by the expression
 | (22) |
where
g is the spectral index of galactic cosmic rays
J(R)  E-g,
and the rigidity spectrum of the variation will be
represented by
 | (23) |
where D E0 is the particle energy variation in background electric fields of the SW.

|
| Figure 6 |
 2 GV, hence it is
impossible to
determine the spectrum parameters
a,
b, and
R0 using only
data from neutron monitors without invoking satellite data. In the rigidity
range
R > R0, expression (21) has a simplified form
 |
where
 |
In this case, the expression for describing the variation spectrum involves only two unknown parameters D Ept and D E 1 R0, which were determined from observed values of (Ji/J0) (R) (triangles in Figure 6).
As follows from a comparison of observed and calculated values of (Ji/J0)(R), the observed spectrum can be explained by the superposition of the particle deceleration and acceleration effects along their propagation trajectory from the Galaxy to the point of observation.

|
| Figure 7 |
 and
u
and
u ,
the CR intensity
variation amplitudes, caused by these variations, must depend on the
direction of arrival of the particles at the point of observation, and the
anisotropy amplitudes will be determined by the magnitude of the effect from
D E1 (R0/R)
(by the difference between curves 1 and 2
in Figure 6).
Furthermore, depending on the particular region of the IMF
loop-like structure where an acceleration of particles occurs, either the
fundamental or the second spherical harmonics (bidirectional anisotropy) will
dominate. If the acceleration occurs due to the polarization component of
the electric field near the point of observation, then the fundamental
harmonic will dominate, with the phase orthogonal to the IMF vector (for
1300-1400 UT, for example) on 15 June (see Figure 4).
In the case of a particle
acceleration at the base of the loop-like structure, a bidirectional
anisotropy with a deficiency of particles in large pitch angles can be
observed (see
right-hand
panels in
Figure 3).
It should be noted that
the phase of the CR bidirectional anisotropy can provide information about
the IMF orientation. For comparison, Figure 7 (taken from a paper
[Richardson et al., 2000])
presents the data on the IMF orientation
determined from the bidirectional anisotropy phase of energetic particles
and particles with 4 GV rigidity, as well as the data of in situ
measurements of the orientation of the IMF vector.
In addition to providing information about the variations of the CR rigidity spectrum and anisotropy outside the magnetosphere, the method used here makes it also possible to obtain information about variations of the planetary system of geomagnetic cutoff rigidities (see Figures 2 and 3). As is apparent from Figure 2, the time profile of DRc is in good agreement with that of the Dst index. In the main phase of the magnetic storm, the value of DRc is ~1.5 GV when Rc = 4 GV. The dependence of DRc on Rc, obtained from an analysis in different phases of the magnetic storm (left-hand panels in Figure 3), is in qualitative agreement with results of calculations of DRc(Rc) in terms of the model of the magnetospheric current distributed across the shell in proportion to the latitude cosine and flowing in a westward direction (see right-hand panels in Figure 3). For a quantitative reconciliation, it seems to be necessary to use a more adequate model of a spatially distributed magnetospheric current system.
The reliability of information obtained can be assessed by the degree of correspondence between the geomagnetic cutoff rigidity variations DRc at Rc = 4 GV and the Dst index (see Figure 2), and from the correspondence of the observed IMF orientation with that determined from the bidirectional anisotropy phase (see Figures 3 and 7), as well as from values of standard deviations d of observed variation amplitudes from calculated ones.
Baisultanova, L. M., et al., Magnetospheric effects in cosmic rays during Forbush decrease, in Proceedings of the XXth International Conference on Cosmic Rays, vol. 4, p. 231, Moscow, Russia, 1987.
Baisultanova, L. M., A. V. Belov, R. T. Gushchina, L. I. Dorman, V. N. Ishkov, and V. G. Yanke, A preliminary analysis of the solar cosmic-ray increase on September 29, 1989 using data from neutron monitors, Izv. Acad. Nauk SSSR, Ser. Fiz. (in Russian), 55 (10), 1877, 1991.
Chapman, S. B., Cosmic rays and magnetic storms, Nature, 140 (3540), 423, 1937.
Dorman, L. I., Cosmic Rays Variations (in Russian), 492 pp., Gostekhizdat, Moscow, 1957.
Dorman, L. I., Galactic Cosmic Rays Variations (in Russian), 214 pp., Moscow State Univ., Moscow, 1975.
Dorman, L. I., and M. I. Tyasto, Effect of the sphere-distributed westward current on geomagnetic cutoff rigidity, in Cosmic Rays (in Russian), 7, 131, 1965.
Dvornikov, V. M., and Yu. G. Matyukhin, Energetic losses of cosmic ray travelling in the solar wind regular magnetic field, Izv. Akad. Nauk SSSR Ser. Fiz. (in Russian), 39 (3), 624, 1976.
Dvornikov, V. M., and V. E. Sdobnov, Modification of the method for spectrographic global survey for studying variations in the planetary system of geomagnetic cutoff rigidities, Izv. Akad. Nauk SSSR Ser. Fiz. (in Russian), 55 (10), 1988, 1991.
Dvornikov, V. M., and V. E. Sdobnov, Analysis of the solar proton event on October 19, 1989, by the method spectrographic global survey, Geomagn. Aeron. (in Russian), 37 (2), 43, 1997a.
Dvornikov, V. M., and V. E. Sdobnov, Time variations of the cosmic ray distribution function during a solar proton event of September 29, 1989, J. Geophys. Res., 102, 24,209, 1997b.
Dvornikov, V. M., V. E. Sdobnov, and A. V. Sergeev, Analysis of cosmic ray pitch angle anisotropy during Forbush effect in June 1972 by the method of spectrographic global survey, in Proceedings of the 18th International Conference on Cosmic Rays, vol. 3, p. 249, Bangalor, India, 1983.
Dvornikov, V. M., V. E. Sdobnov, and A. V. Sergeev, Anomalous variations of the cosmic ray energy spectrum during some periods of 1972, in Proceedings of the XXth International Conference on Cosmic Rays, vol. 4, p. 91, Moscow, 1987.
Krymskiy, G. F., et al., Cosmic ray distribution and reception vectors of detectors, 1, Geomagn. Aeron. (in Russian), 6, 991, 1966.
Lockwood, J. A., and W. R. Webber, Differential response and specific yield functions of cosmic ray neutron monitor, J. Geophys. Res., 72, 3395, 1967.
McCracken, K. G., et al., Cosmic ray tables, (Asymptotic directions, variational coefficients and cutoff rigidities), in IQSY Instruction Manual, no. 10, p. 104, London, UK, 1965.
Morozov, A. I., and L. S. Soloviev, The motion of charged particles in electromagnetic fields, in Voprosy Teorii Plazmy (in Russian), vol. 2, 177, Gosatomizdat, Moscow, 1963.
Nagashima, K., Three-dimensional cosmic ray anisotropy in interplanetary space, Rep.Ionos. Space Res. Jpn., 25 (3), 189, 1971.
Parker, E. N., Interplanetary Dynamical Processes, Interscience Publishers, John Wiley and Sons, New York, 1963.
Richardson, I. G., et al., Bidirectional particle flows at cosmic ray and lower (~1 MeV) energies and their association with interplanetary coronal mass ejections/ejecta, J. Geophys. Res., 105 (6), 12,579, 2000.
Shea, M. A., and D. F. Smart, Possible evidence for a rigidity-dependent release of relativistic protonsfrom the solar corona, Space Sci. Rev., 32 (1/2), 251, 1982.
Shea, M. A., D. F. Smart, and K. G. McCracken, A study of vertically incident cosmic ray trajectories using sixty-degree simulations of geomagnetic field, Rep. AFCRL-65-705, Air Force Cambridge Res. Labs., Bedford, Mass., 1965.
Treiman, S. B., Effect of equatorial ring current on cosmic ray intensity, Phys. Rev, 89 (1), 130, 1953.
World Data Cent. for Cosmic Rays, in Cosmic Ray Neutron Database, Toyokawa, Japan.
Webber, W. R., Some features of the response of neutron monitor to low energy particles incident on the atmosphere, Can. J. Phys., 10, 906, 1962.
Webber, W. R., and J. J. Quenby, On the derivation of cosmic ray specific yield functions, Philos. Mag., 4 (41), 654, 1959.