4. Diurnal Dependence of the Amplitude of TEC
Variations
[17] Now we consider in detail the diurnal dependencies of the
averaged values of TEC
 I
I , of the relative
dI/I and of the absolute
dI amplitudes of TEC variations for several quiet and disturbed days.
We start our analysis with the conditions of the midlatitude
ionosphere and then will note the features of the high-latitude
and equatorial ionosphere.
, of the relative
dI/I and of the absolute
dI amplitudes of TEC variations for several quiet and disturbed days.
We start our analysis with the conditions of the midlatitude
ionosphere and then will note the features of the high-latitude
and equatorial ionosphere.
|
|
Figure 1
|
|
|
Figure 2
|
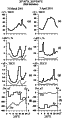
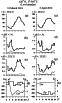
[18] To illustrate a typical diurnal dependence at middle
latitudes, we chose four days: moderately disturbed (quiet) days
on 3 April 2001 and 3 November 2003 and also the days when strong
magnetic storms were observed: 31 March 2001 and 30 October 2003
(Figures 1 and 2, right and left, respectively). The geomagnetic
activity indices
Dst and
Kp are shown in Figures 1d, 2d, 1h,
and 2h, respectively. The diurnal dependencies of the averaged TEC
values
I are shown in Figures 1a, 2a, 1e, and
2e. The dependencies of the relative
dI/I amplitude of the TEC variations are shown in Figures 1b, 2b, 1f,
and 2f. The same values for the absolute
dI amplitude of the TEC variations are shown in Figures 1c, 2c, 1g,
and 2g. MS and IS ionospheric irregularities are shown by thick
and thin lines, respectively.
[19] Figures 1 and 2 show a smooth variation of
I in quiet period with the TEC maximum reaching in the
daytime (1200-1600 LT). This behavior corresponds to the regular
TEC behavior obtained for a quiet period by the measurement of the
turning angle of the polarization plane of the VHF signals of
geostationary satellites [Afraimovich et al.,
1999; Davies, 1980] and also by
the measurement of the difference in the phase and group delay of
the GPS signals at two coherently related frequencies [Kotake et al., 2006; Mannucci et al.,
1998]. The absolute amplitude
dI for MS and IS ionospheric irregularities varies within 0.1-0.7
TECU (TECU
=1016 m-2 ) and 0.01-0.03 TECU,
respectively, reaching maximum value also in the daytime.
[20] However, in disturbed conditions the character of
dI dependence changes considerably. The value of the
absolute amplitude
dI increases by a factor of
3-4 (Figure 1) or even by an order of magnitude (Figure 2),
reaching 3 TECU. At the same time the
dI maximum
shifts to the time moment corresponding to the maximum deviation
of the
Dst and very high level
Kp=9. This effect is especially
visual during the main phase of the strong magnetic storm on 30
October 2003. Nevertheless, the maximum values of
dI are observed mainly in the daytime.
[21] The diurnal behavior of the relative amplitude
dI/I differs cardinally from the corresponding dependence
of
dI . It is especially distinctly pronounced in
quiet conditions: the
dI/I maximums for MS and
IS ionospheric irregularities are observed at night, not in the
daytime.
[22] In disturbed conditions the changes in
dI/I are governed not only by diurnal behavior but by the magnetic
field as well. The vertical line in Figure 2 shows the moment of a
sharp peak of
dI on 30 October 2003, when the
value of
dI reached 3 TECU. This example shows
that the geomagnetic control of the amplitude of TEC variations at
high levels of the magnetic field disturbances appear to be more
important than the regular diurnal variations.
|
|
Figure 3
|
|
|
Figure 4
|
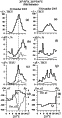
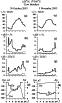
[23] At high latitudes (Figures 3 and 4) the diurnal dependence
of TEC and its variations in quiet and disturbed conditions differ
from the same at middle latitudes. First, both have higher
amplitudes. For example, the absolute and relative amplitudes
dI and
dI/I during the main
phase of the magnetic storm on 30 October 2003 reach 16 TECU and
50%, respectively.
[24] Moreover, at high latitudes one can note a slight
difference in amplitudes
dI and
dI/I of TEC variations for ionospheric irregularities of
different scales (not more than by a factor of 2). At middle
latitudes this difference reaches an order of magnitude. This fact
indicates that there is a cardinal decrease in the declination of
the power spectrum of TEC disturbances due to the increase in the
amplitude of the small-scale part of the spectrum [Afraimovich et al., 2001].
|
|
Figure 5
|
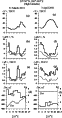
[25] Even more distinction with middle latitudes is observed at
|
|
Figure 6
|
the equator (Figures 5 and 6). First, in disturbed conditions the
increase in the relative and absolute amplitudes as compared to
quiet conditions is weaker (not more than by a factor of 1.5-2).
The maximum value of the relative amplitude
dI/I systematically is observed at night. This regularity is not broken
even during the main phase of the magnetic storm independent of
the local time during which this phase occurs. This conclusion
agrees completely with the widely known morphology of ionospheric
scintillations at equatorial latitudes based on numerous
measurements by different ionospheric sounding methods [Aarons, 1982; Yeh and Liu, 1982].

|
|
Figure 7
|
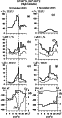
[26] For the quiet days the above noted latitudinal dependencies
are pronounced especially clearly at daily mean values. Figure 7
shows the diurnal dependencies of the averaged values of the
absolute
dI
(Figures 7a-7c) and relative
dI/I (Figures 7d-7f) amplitudes of IS (thin
lines) and MS (thick lines) TEC variations for 12 quiet days ( Kp < 3 ): Figures 7a and 7d, 7b and 7e, and 7c and 7f correspond to
high, middle, and equatorial latitudes, respectively. One can see
from Figure 7 that the maximum values of the relative amplitude of
the TEC variations almost do not depend on latitude and are
observed mainly at night.
[27] In quiet conditions the nighttime
dI/I values
significantly exceed the daytime value by a factor of 3-5 at low
and high latitudes and by a factor of 2 at middle latitudes. At a
high level of magnetic field disturbance, the geomagnetic control
of the TEC variation amplitude is even more significant than the
regular diurnal variations.

Powered by TeXWeb (Win32, v.2.0).