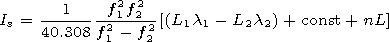
[10] The standard GPS technology provides a means for calculation of slant TEC Is along line of sight (LOS) between GPS satellite and receiver based on phase measurements at each of spaced two-frequency GPS receivers. Data of phase measurements are contained in the RINEX files, available at ftp://sopac.ucsd.edu/pub/.
[11] A method of the TEC calculating was specified and validated in a series of publications [e.g., Afraimovich, 0]. We reproduce here only the final formula for phase measurements:
| (1) |
[12] Phase measurements in the GPS can be performed with a high
degree of accuracy corresponding to the error of TEC determination
of at least
1013 m-2 when averaged on a 30-s time
interval, with some uncertainty of the initial value of TEC,
however. Filtered out in the range of periods 30-60 min, the
standard deviation of TEC series is not worse than
0.2  1013 m-2.
[13] To normalize the response amplitude, we have converted "slant'' TEC Is to an equivalent "vertical'' value I [Klobuchar, 1986]:
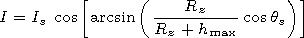 | (2) |
[14] Then we selected continuous TEC series
I(t) with a
duration of about 2 hours from the obtained TEC data so that we
had 22 overlapping time intervals with a 1-hour shift for the day.
We used specified threshold of
30o for elevations
qs to the GPS satellites.
I(t) series for all GPS sites in the
region under consideration and for all visible satellites were
filtered in the timescale of 20-60 min and 2-10 min using
running average filtering. Standard deviation
s of TEC
variations was calculated for each series. The
s values
were averaged on all series; thus we got for each 2 hours time
interval the mean absolute values
dI = [S si]/m,
where
i =1, 2,  , m;
m is a total number of series. The
dI represents an absolute value of the amplitude of TEC
variations. The distribution of the number of series
Im over
days is shown in Table 1. The total number of analyzing series is
about
106.
, m;
m is a total number of series. The
dI represents an absolute value of the amplitude of TEC
variations. The distribution of the number of series
Im over
days is shown in Table 1. The total number of analyzing series is
about
106.
[15] The relative amplitude dI/I0 is determined by normalization of the dI to the background I0 value, where I0 is the absolute vertical TEC obtained with 2-hour time resolution from the global TEC maps in the IONEX format (the so-called global ionospheric maps (GIM) [Mannucci et al., 1998]). The spatial range of GIM is 0-360o in longitude and 90oS-90oN in latitude. The spatial resolution is restricted by the dimensions of an elementary GIM cell ( 5o and 2.5o in longitude and latitude, respectively). For the normalization, the I0 values are used for the GIM cell closest to the GPS station used for determination of the dI value.
[16] The series
Im,
dIm, and
dI/Im were averaged over
the chosen area to obtain the mean values of TEC
 I
I ,
of the absolute amplitude
dI and of the
relative amplitude
dI/I of TEC variations in the
period ranges of MS and IS ionospheric irregularities.
,
of the absolute amplitude
dI and of the
relative amplitude
dI/I of TEC variations in the
period ranges of MS and IS ionospheric irregularities.

Powered by TeXWeb (Win32, v.2.0).