2. Analysis of the Available Models
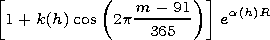
[4] Belikovich et al. [1983]
used as initial data for creation of the
model the original results of the measurements by the PR method for the
period 1969-1980 and also the results of the measurements by the PR
and cross-modulation methods, as well as in rocket experiments
published in literature (totally about 500 measurements). The variations
in the electron concentration with solar zenith angle ( c ), season, and
solar activity (the Wolf number,
W ) were described by
where the initial height is
h0 = 60 km,
p = 0.5-0.9,
a = -0.008  0.012 depending on
h,
m is the number of days counted from 21 March. The
coefficient
k determining the seasonal variations of
ne(h) is positive at
heights of 60-80 km and negative at heights of 85-95 km. The model is
applicable in the latitude range
j = 30o-60o at altitudes 60-95 km in the
sunlit period of a day, and in quiet geophysical conditions. The
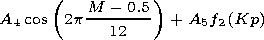
Danilov et al. [1991, 1995]
model was created on the basis of the database
including 276 profiles with
ne values at altitudes of 60-85 km obtained
by various rocket methods during the period from 1948 to 1978 in the
latitude interval 81oN-30oS.
The model makes it possible to calculate
the values of
ne(h) in the lower ionosphere depending on
c, season (S)
and geomagnetic index ( Kp ). The model takes into account the
meteorological effects: the winter anomaly events and stratospheric
warmings according to
where
A0-A5 are the coefficients different for different
altitudes (with a
step of 5 km) determining variations depending on each of the
parameters taken into account. The global model by
Chasovitin [1988]
is
created for the 80-600 km range, however below 200 km the electron
concentration is calculated using the
Chasovitin [1983]
model. The latter
may be used for the conditions of moderate solar activity
( 100
0.012 depending on
h,
m is the number of days counted from 21 March. The
coefficient
k determining the seasonal variations of
ne(h) is positive at
heights of 60-80 km and negative at heights of 85-95 km. The model is
applicable in the latitude range
j = 30o-60o at altitudes 60-95 km in the
sunlit period of a day, and in quiet geophysical conditions. The
Danilov et al. [1991, 1995]
model was created on the basis of the database
including 276 profiles with
ne values at altitudes of 60-85 km obtained
by various rocket methods during the period from 1948 to 1978 in the
latitude interval 81oN-30oS.
The model makes it possible to calculate
the values of
ne(h) in the lower ionosphere depending on
c, season (S)
and geomagnetic index ( Kp ). The model takes into account the
meteorological effects: the winter anomaly events and stratospheric
warmings according to
where
A0-A5 are the coefficients different for different
altitudes (with a
step of 5 km) determining variations depending on each of the
parameters taken into account. The global model by
Chasovitin [1988]
is
created for the 80-600 km range, however below 200 km the electron
concentration is calculated using the
Chasovitin [1983]
model. The latter
may be used for the conditions of moderate solar activity
( 100  F10.7 150 )
and quiet geomagnetic situation ( Kp 4 ). The model is presented
in the form of tables calculated for each variation in the input
parameters. The
Bilitza et al. [1981]
model was a basis for the
description of the dependency of the undisturbed lower ionosphere
structure on the time of a day (day-night), solar zenith angle, and solar
activity in the models IRI 1979, 1990, 1995/96, and 2001. The model
considers only rocket measurements (about 80). The vertical profile of ne
is approximated by the polynomial of the third degree centered above
and below the inflection point located at a height of
h = 81 km. Two
latitudinal intervals are considered: the lower and middle (however the
differences between them are negligible). It is shown that the value of
ne in the inflection point may be given by
where
R12 is the running mean (over 12 years) Wolf number. The
Pancheva and Mukhtarov [1997]
model was created on the basis of the
measurements of the radio wave absorption obtained by the A3 method.
The data obtained only in Bulgaria were used, so the model does not
provide the global structure of the lower ionosphere. Nevertheless the
model analyzes in detail diurnal and seasonal variations of
ne. The model
profile
n(h) is presented in some set of characteristic points connected by
cubic splines to provide the continuity of the profile. The values of
ne are
determined unambiguously only in the characteristic points and the
variations of the
ne(h) profile with
c,
F10.7,
and season are modeled
changing the values of
ne in these characteristic points.
Friedrich and Torkar [1992]
actually described in their model only the dependence of
the electron concentration on the solar zenith angle. This was due to the
very limited database of the initial data (72 profiles obtained by the
rocket method). The model is created for moderate solar activity
( W =60 ), middle latitudes and undisturbed geomagnetic conditions.
McNamara [1979]
collected and analyzed about 700 profiles of ne
obtained mainly by rocket methods and PR methods. This publication is
the only one in which an attempt is made to take into account the
longitudinal effects in the lower ionosphere mentioned earlier by
George [1971]
and
Mechtly et al. [1969].
However, the longitudinal effects in the
McNamara [1979]
model are taken into account in the latitudinal
dependence of
ne due to the difference in the measurement points of
geographic ( j ) and geomagnetic ( q )
latitudes as well as of the modified
dipole latitude
X = arctan (I/ cos j ). The expression for the electron
concentration at the given height is presented by the linear function:
where M is the number of the month.
F10.7 150 )
and quiet geomagnetic situation ( Kp 4 ). The model is presented
in the form of tables calculated for each variation in the input
parameters. The
Bilitza et al. [1981]
model was a basis for the
description of the dependency of the undisturbed lower ionosphere
structure on the time of a day (day-night), solar zenith angle, and solar
activity in the models IRI 1979, 1990, 1995/96, and 2001. The model
considers only rocket measurements (about 80). The vertical profile of ne
is approximated by the polynomial of the third degree centered above
and below the inflection point located at a height of
h = 81 km. Two
latitudinal intervals are considered: the lower and middle (however the
differences between them are negligible). It is shown that the value of
ne in the inflection point may be given by
where
R12 is the running mean (over 12 years) Wolf number. The
Pancheva and Mukhtarov [1997]
model was created on the basis of the
measurements of the radio wave absorption obtained by the A3 method.
The data obtained only in Bulgaria were used, so the model does not
provide the global structure of the lower ionosphere. Nevertheless the
model analyzes in detail diurnal and seasonal variations of
ne. The model
profile
n(h) is presented in some set of characteristic points connected by
cubic splines to provide the continuity of the profile. The values of
ne are
determined unambiguously only in the characteristic points and the
variations of the
ne(h) profile with
c,
F10.7,
and season are modeled
changing the values of
ne in these characteristic points.
Friedrich and Torkar [1992]
actually described in their model only the dependence of
the electron concentration on the solar zenith angle. This was due to the
very limited database of the initial data (72 profiles obtained by the
rocket method). The model is created for moderate solar activity
( W =60 ), middle latitudes and undisturbed geomagnetic conditions.
McNamara [1979]
collected and analyzed about 700 profiles of ne
obtained mainly by rocket methods and PR methods. This publication is
the only one in which an attempt is made to take into account the
longitudinal effects in the lower ionosphere mentioned earlier by
George [1971]
and
Mechtly et al. [1969].
However, the longitudinal effects in the
McNamara [1979]
model are taken into account in the latitudinal
dependence of
ne due to the difference in the measurement points of
geographic ( j ) and geomagnetic ( q )
latitudes as well as of the modified
dipole latitude
X = arctan (I/ cos j ). The expression for the electron
concentration at the given height is presented by the linear function:
where M is the number of the month.

Powered by TeXWeb (Win32, v.1.6).