INTERNATIONAL JOURNAL OF GEOMAGNETISM AND AERONOMY VOL. 5, GI3008, doi:10.1029/2004GI000067, 2005
3. Development of Solar Cycle 23 in the Outer
Heliosphere
[8] In general, in the part of the heliosphere
where the solar wind structure does not change with
distance, the GCR intensity variations at different
heliocentric distances also should be similar. In this
connection it is interesting to compare the
development of the solar cycle variation in the GCR
intensity of the same species and energy
T near the
Earth and in the distant heliosphere. It would be
possible for the present solar cycle using the GCR
intensities JH for the hydrogen, averaged in the range
T = 120-240 MeV, and
JHe for the helium,
Tn = 180-450 MeV n-1,
measured aboard the IMP 8,
Voyager 1 and Voyager 2 spacecraft, but
unfortunately, the data from the near the Earth IMP 8
stopped being detected systematically in October
2001 (see
http://nssdc.gsfc.nasa.gov/database/MasterCatalog?sc=1973-078A).
[9] However it is possible to estimate what the
detectors aboard IMP 8 would measure after
10.2001 using the cosmic ray data from other
experiments. Of course, it would be better if the
GCR data in the energy ranges in question could be
inferred from the direct measurements aboard some
spacecraft still in operation. For the time being as an
alternative we use the stratospheric data.
Krainev and Webber [2003]
used the count rate of the
omnidirectional Geiger counter in the Pfotzer
maximum at Murmansk (the cutoff rigidity
Rc=0.6 GV, the medium rigidity during solar cycle maxima
Rm  9 GV
[Svirzhevsky, 2003])
for this purpose.
However, the effective rigidities of the GCR
particles contributing to
N1Mu max and
JH,
JHe, are too
different, and
Krainev and Webber [2005]
suggested
for the purpose of estimating the IMP 8 intensities
using the difference between the count rates of the
Geiger counter in the Pfotzer maximum at
Murmansk and Moscow,
N1MM max = N1Mu max- N1Mo max (the
effective rigidity
Re < 1 GV).
Krainev and Webber [2005]
studied in the first approximation the
test time series
JH,
JHe, and
N1MM max, their possible
trends and regression relationship and made the
estimation for the time period from October 2001 to
November 2004 of the IMP 8 26-day averaged
intensities, smoothed with the periods 0.5 and 2
years. Below we use the results of this estimation for
the 0.5-year smoothed time series.
9 GV
[Svirzhevsky, 2003])
for this purpose.
However, the effective rigidities of the GCR
particles contributing to
N1Mu max and
JH,
JHe, are too
different, and
Krainev and Webber [2005]
suggested
for the purpose of estimating the IMP 8 intensities
using the difference between the count rates of the
Geiger counter in the Pfotzer maximum at
Murmansk and Moscow,
N1MM max = N1Mu max- N1Mo max (the
effective rigidity
Re < 1 GV).
Krainev and Webber [2005]
studied in the first approximation the
test time series
JH,
JHe, and
N1MM max, their possible
trends and regression relationship and made the
estimation for the time period from October 2001 to
November 2004 of the IMP 8 26-day averaged
intensities, smoothed with the periods 0.5 and 2
years. Below we use the results of this estimation for
the 0.5-year smoothed time series.

|
|
Figure 4
|
[10] In Figures 4a and 4b the 26-day averaged and
smoothed with a 0.5-year period intensities
measured aboard the Voyagers 1 and 2
(http://voycrs.gsfc.nasa.gov/heliopause/heliopause.html)
and IMP 8 spacecraft are shown for 1995-2004.
The data in Figures 4a and 4b are for the GCR
protons and helium nuclei, respectively, in the
energy ranges very close to those listed above for
IMP 8. The first fact one can notice is that the GCR
intensity modulation in the minimum epoch of the
current solar cycle began near the Earth much earlier
than in the outer heliosphere (the maxima in the 2-year
smoothed intensity-time profiles are
tm23 =1997.1 and 1998.9
[see Krainev and Webber, 2005]).
The difference in the corresponding times of
the first gap ( tg123 ) in the double-gap structure of the
0.5-year smoothed intensity-time profiles is not so
significant (approximately 2001.0 and 2001.7 for
IMP 8 and for Voyagers 1 and 2, respectively).
Krainev and Webber [2005]
suggested that this fact
reflects the magnetic drift effects for
qA>0 phase of
the solar magnetic cycle. As to the maximum phase
in the GCR intensity, the main feature that one can
see in Figures 4a and 4b is that although there is a
double-gap structure with the Gnevyshev peak
between the gaps in each intensity time profile, this
structure for the intensity measured in the outer
heliosphere looks rather strange, especially for the
higher energy helium nuclei. Suffice it to note that
the helium intensity around the Gnevyshev peak at
the Voyager 1 is in excess of the maximum intensity
in 1998!
Krainev and Webber [2003]
even suggested
that the GCR intensity peaks at Voyager 1 have
something in common with the very high fluxes of
the low energy particles measured there in 2002-2003
and connected by some investigators
[Krimigis et al., 2003;
McDonald et al., 2003;
Zeldovich et al., 2003]
with the effects of the
termination shock.
[11] Krainev and Webber [2005]
suggested that
the "strangeness" of the double-gap structure of the
GCR intensity-time profiles in the outer heliosphere
and its difference from the corresponding double-gap
structure near the Earth could be due to the
strong 22 wave in the GCR intensity, observed in the
outer heliosphere. In order to allow for both the
changing heliocentric distance
r(t) of the spacecraft
and the 22 wave we suggested normalizing the
absolute GCR intensity,
J(r, t),
using the GCR
intensity radial profiles during the minimum
( Jmi(r) ),
and maximum
( JMi(r) )
of the
i th solar
cycle, in the following way:
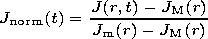 | (1) |
The radial profiles of the GCR intensity in the
extreme phases for solar cycles 21-23 were
determined by
Krainev and Webber [2005]
using the
intensity time series smoothed with a 2-year period.
Besides, as the radial profile for the next
minimum of solar activity is still unknown, we
suggested that
Jm24(r) = Jm22(r) , that is, that the GCR
intensity radial profile in the minimum of solar cycle
depends only on the IMF polarity. Note that using
(1) one should take into account the change with
time of the current radial profiles of the GCR
intensity in the extreme phases of solar cycle.
Namely, if and are the moments when the 2-year
smoothed intensity attains its maximum
( Jmi )
and minimum
( JMi )
values in the
i th solar cycle, the
radial profiles
( Jmi(r) )
and
( JMi(r) )
should be used in
(1) for
tMi-1< t < tMi and
tmi< t < tmi+1,
respectively
(for the sake of simplicity, we suggested that the
reversal of the high-latitude solar and heliospheric
magnetic field in the
i th solar cycle occurs in the
moment
tMi ).
[12] In Figures 4c and 4d the same GCR intensities
are shown as in Figures 4a and 4b; however, they are
normalized according to (1). Besides, we allowed for
the trivial effect of the difference
D r=r - 1, AU, in
the radial distance of the spacecraft with respect to 1 AU,
plotting
Jnorm(t - D r/Vsw ),
with
Vsw = 450 km
s-1.
One can see that the double-gap structure of the
GCR intensity in the outer heliosphere took its usual
form, even the positions of the first gap and
Gnevyshev peak near the Earth and in the outer
heliosphere being approximately the same. So
probably the peak in the GCR intensity observed at
Voyager 1 in 2002 does not have relation to the
effects of the termination shock. The second gap in
the outer heliosphere has not been completed by the
2004.7, but we expect it to be formed in the next half
a year. Now we cannot state if the main cause of the
significant difference in the magnitude of the
Gnevyshev peak in the GCR intensity between the
inner and outer heliosphere is due to smoothing of
the double-gap structure with the radial distance, or
just to the defects either of the method of the
estimation of the IMP 8 GCR intensity since
October 2001 or of the method of the GCR intensity
normalization used by us. We are working on the
improvement of these methods.

Citation: Krainev, M. B., and W. R. Webber (2005), The development of the maximum phase of solar cycle 23 in the galactic cosmic ray intensity, Int. J. Geomagn. Aeron., 5, GI3008, doi:10.1029/2004GI000067.
Copyright 2005 by the American Geophysical Union
Powered by TeXWeb (Win32, v.1.5).