RUSSIAN JOURNAL OF EARTH SCIENCES, VOL. 21, ES1007, doi:10.2205/2020ES000757, 2021
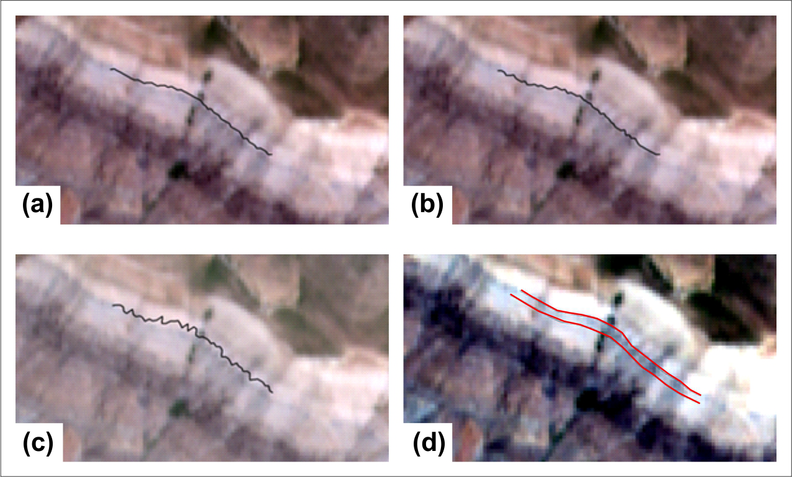
Figure 6. Influence of the signal-to-noise-ratio on the quality and appearance of a trace line on an original DEM in high resolution (a), on a DEM with added random noise (i.e., 5% of the absolute altitude range; b), and on a DEM with added random noise (i.e., 12.5% of the absolute altitude range; c). The signal-to-noise-ratio of the third tile (c) is typical for the Richãt Structure. The last tile (d) shows the respective bedding boundaries (of which the northern one corresponds to the trace line) on a contrast-enhanced satellite image. The depicted structure is located at 35° 52'48.00"N, 51° 07'15.60"E east of the Vineh Structure.

![]()
Citation: Faber R., G. Domej (2021), 3D Computer-Assisted Geological Mapping: Testing WinGeol's FaultTrace for semi-automatic structural geological assessment, Russ. J. Earth Sci., 21, ES1007, doi:10.2205/2020ES000757.
Copyright 2021 by the Geophysical Center RAS.
Generated from LaTeX source by ELXfinal, v.2.0 software package.