RUSSIAN JOURNAL OF EARTH SCIENCES, VOL. 21, ES1007, doi:10.2205/2020ES000757, 2021
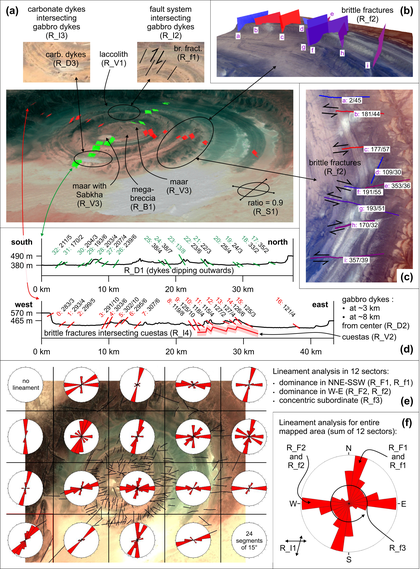
Figure 4. Mapping of the Richãt Structure with FaultTrace: (a) 3D view showing plane element orientations along the two main axes; (b, c) 3D and 2D views showing the heavily sheared zone in the eastern part; (d) 2D view showing the cross-sections along the two main axes; (e) 2D view showing distributions of lineament orientations per sector; (f) lineament rose showing the overall distribution of lineament orientations. All vertical axes are ten-fold exaggerated (a, b, d); lateral scale relations are given in the cross-sections (d).

![]()
Citation: Faber R., G. Domej (2021), 3D Computer-Assisted Geological Mapping: Testing WinGeol's FaultTrace for semi-automatic structural geological assessment, Russ. J. Earth Sci., 21, ES1007, doi:10.2205/2020ES000757.
Copyright 2021 by the Geophysical Center RAS.
Generated from LaTeX source by ELXfinal, v.2.0 software package.