
RUSSIAN JOURNAL OF EARTH SCIENCES, VOL. 21, ES1001, doi:10.2205/2020ES000746, 2021
Mau Dinh Le1, Galina Vlasova2, Dung Thi Thuy Nguyen1
1Institute of Oceanography, Vietnam Academy of Science and Technology (IO-VAST), Nha Trang City, Vietnam
2Il'ichev Pacific Oceanological Institute, Far Eastern Branch RAS (POI FEB RAS), Vladivostok, Russia
On the basis of statistical analysis, studies of the features of the distribution of typhoons in the South China Sea for the period 1951–2019 were carried out using satellite information. As a result, it was revealed that 851 typhoons were observed over the water area of the South China Sea (SCS) during this period. Of these, 464 had a maximum speed of over 33 m/s. Typhoons were observed more often in the northern part of the sea and were more intense than in the southern one. Most typhoons originate in the northwestern Pacific Ocean near the Philippine Islands, while the rest originate directly in the South China Sea. The South China Sea has an average of more than 12 storms per year, which is about half of all storms in the NW Pacific. As a general rule, the highest frequency of storms in the SCS during the mid-summer to mid-autumn period (July–September) is the period with a strong tropical convergence zone in the northern hemisphere. Occurrences of hurricanes (the most powerful typhoon with a maximum wind speed of over 33 m/s) were mostly in September: 146 storms were observed over the entire study period. More than 18 typhoons were observed for 5 years (1964, 1971, 1974, 1995, 1996) for the period. In 1964 and 1996, both years have 21 hurricanes crossed the South China Sea. The areas with very strong storms in Vietnam are Quang Ninh and South Ha Tinh – Deo Ngang and the less active storm areas are Vung Tau – Ho Chi Minh City.
|
| Figure 1 |
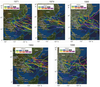
The South China Sea (SCS) covers an area of 3,447,000 km$^2$, including the Gulf of Tonkin and the Gulf of Thailand, with an average depth of 1140 m, the maximum measured depth – 5567 m, volume of water mass about 3,928,000 km$^3$, a length of 3500 km (Figure 1). The SCS is relatively enclosed, surrounded by islands and mainland. The SCS is connected with neighboring seas and oceans through straits. The southwestern part of the SCS opens to the Indian Ocean by the Strait of Malacca between Peninsula Malaysia and Sumatra Island (Indonesia). The southern part of the sea is connected with the Indian Ocean through the Karimata Strait, and the Java Sea (Indonesia) through two Sunda gates (between Jakarta and Lombok (near Bali)). The northern part of the sea is connected to the East China Sea by the Taiwan Strait. The eastern part of the sea is connected to the Philippine Sea (western Pacific) by the large Luzon Strait and other deep-water straits of the Philippine Islands.
The SCS is surrounded by 9 countries: China, the Philippines, Malaysia, Indonesia, Brunei, Singapore, Thailand, Cambodia, and Vietnam. There are also dependent territories with developed economies, such as Taiwan, Hong Kong, Macau, located on the northeastern coast of the SCS. China is the largest country bordering by the SCS. Indonesia and the Philippines have thousands of large and small islands in the southern and eastern parts of the SCS. Vietnam is the western coastal country of the SCS, along with Cambodia and Thailand, and Vietnam has 3260 km of coastline.
Hurricanes and tropical depressions are natural disasters. The influence of a tropical storm on socio-economic activities in Vietnam's coastal regions is very serious. Hurricanes cause not only strong winds and high waves, which directly affect economic activity at sea but also torrential rains, floods, landslides, etc., directly affecting all sectors of the international economy and people's lives.
At present, many different studies of fluctuations in the characteristics of storms and tropical depressions in the SCS and the coastline of Vietnam have been carried out based on various sources and research methods. The tropical cyclone and cyclones databases used in the studies also have differences. For example, CMA (China Meteorological Administration, China), takes an average wind speed for 2-minutes, JTWC (Joint Typhoon Warning Center, USA) – 1-minute, other objects such as JMA (Japan Meteorological Agency, Japan), HKO (Hong Kong Observatory, Hong Kong), IBTrACS (International Archive of the Best Climate Management Tracks) – 10-minutes. It is noted in the report of the WMO (World Meteorological Organization) on the impact of climate change on tropical cyclones in 2012 [WMO, 2012]. The report also shows that most tropical cyclones and cyclones that occur in the Philippines and the SCS are concentrated in the latitudes between $10\mbox{°}$ and 25° N. According to the results of the study by Dinh Van Uu, [2011], the north-central region of the coast of Vietnam (17°–20° N) is subject to the most severe storms and typhoons. Vu Thanh Hang et al., [2010] using data from the US Department of Meteorology for 1945–2007 showed that the number of storms increased linearly over the specified period. However, since the authors did not indicate the method for selecting eddies for statistics, it is really difficult to compare with our results. According to these authors, in the period from 1945 to 2007, the largest number of storms (13) was in 1996. Using the data of the Japan Meteorological Office for the period 1951–2019, we found that the largest number of typhoons and tropical depressions was in 1964 and 1996 (21).
In this paper, information from various databases was used to statistically analyze the characteristics of typhoons in SCS (type, category, pressure, maximum sustained wind speed) to create a collection of these parameters for the period 1951–2019.
 |
| Table 1 |
The collection of data on tropical cyclones that struck the coast of the SCS in the period from 1951 to 2019 was carried out from the websites: https://coast.noaa.gov/hurricanes/ (USA) and http://www.jma.go.jp/jma/jma-eng/jma-center/rsmc-hp-pub-eg/RSMC_HP.htm (Japan). Indicated data include wind speed, the pressure at the center of the cyclone, its position, the radius of maximum wind speed, and the trajectory of tropical cyclones. The hurricane scale was determined by the Saffir-Simpson scale used by the United States National Meteorological Service (Table 1).
From this Saffir-Simpson Scale, hurricanes were selected as the highest category of cyclones for the period 1951–2019. Based on the statistical analysis, all identified hurricanes in the South China Sea in the range of 0°–24° N and 99°–122° E have been analyzed.
 |
| Table 2 |
In total, 851 hurricanes occurred in the water area of the SCS, including 464 typhoons with a maximum wind speed ($V_{\mathrm{max}})> 33$ m/s, 298 tropical storms with 17 m/s $< V_{\mathrm{max}} <33$ m/s and 89 subtropical storms with $V_{\mathrm{max}} <17$ m/s (Table 2).
 |
| Figure 2 |
The Philippine Sea in the east is the place where most of the typhoons occur, the rest of the typhoons originate directly in the SCS. The SCS has an average of more than 12 storms per year, which is about half of all storms in the NW Pacific (Figure 2). As a general rule, the highest frequency of storms in the SCS during the mid-summer to mid-autumn period (July–September) is the period with a strong tropical convergence zone in the northern hemisphere.
According to Le Duc To, [1999], the north of the SCS region is where storms from the Pacific Ocean or from the eastern part of the SCS usually occur from mid-summer onwards, with very strong intensity on the way to the west. Wind speeds in the strongest storm can reach and exceed 50 m/s, causing enormous destruction. Storms in the north of the SCS appear more often in summer. The southern part of the SCS observed much fewer storms than the northern part. Storms in the southern part were observed later than in the northern. Also, typhoons operating in the southern parts of the SCS are usually less intense than storms operating in the north. The number of storms hitting Vietnam varies greatly at different years and different latitudes.
 |
| Figure 3 |
 |
| Figure 4 |
From Figure 3 can be seen that the interannual distribution of hurricanes in the study area was not regular. The number of hurricanes (over 18) was observed in 1964, 1971, 1974, 1995, 1996. Of these, 21 hurricanes were observed in 1964 and 1996 (Figure 4).
 |
| Figure 5 |
 |
| Table 3 |
Occurrences of hurricanes were mostly in September (17.16%), July (14.92%), August (14.69%), October (14.22%), and November (13.98%) (see Table 3 and Figure 5).
According to Le Duc To, [1999], storms occur rarely in May and June, the direction of movement is usually north and northwest or northeast, following a parabolic orbit towards the southern coast of China. In the following months, including July, August, and September, the storm usually moves in a northwest direction, then, reaching the coast of southern China, turns west and heads towards northern Vietnam. In October, the trajectory of typhoons is on average oriented westward towards the central coast of Vietnam. In November and December, its shifts south (13°–12° N) to the coast of southern Vietnam.
Thus, for the whole Vietnamese coast, the typhoon season is from June to December. In Vietnam, the areas with very strong storms are from Quang Ninh to Ha Tinh (21.5°–18° N) and the less active storm areas are from Vung Tau to Ca Mau (10.5°–8° N).
Dinh, Van Uu (2011) , The characteristics of storm fluctuations and tropical depressions directly affect the mainland of Vietnam, Journal of the Nature Science and Technology, 27, p. 266–272 (in Vietnamese).
Le, Duc To (1999) , Oceanography in the South China Sea, 127 pp., The Vietnam National University, Hanoi (in Vietnamese).
Vu, Thanh Hang, et al. (2010) , Some characteristics of typhoon activity in Vietnam coastal regions during 1945–2007, Journal of Science, Natural Sciences and Technology, 26, no. 3S, p. 344–353 (in Vietnamese).
WMO, (2012) , WMO statement on the status of the global climate in 2012, WMO-No. 1108, Communications and Public Affairs Office, Geneva (http://www.wmo.int).
Received 12 October 2020; accepted 26 October 2020; published 11 January 2021.

Citation: Le Mau Dinh, Galina Vlasova, Dung Thi Thuy Nguyen (2021), Distribution features of the typhoons in the South China Sea, Russ. J. Earth Sci., 21, ES1001, doi:10.2205/2020ES000746.
Copyright 2021 by the Geophysical Center RAS.