RUSSIAN JOURNAL OF EARTH SCIENCES, VOL. 20, ES6001, doi:10.2205/2020ES000721, 2020
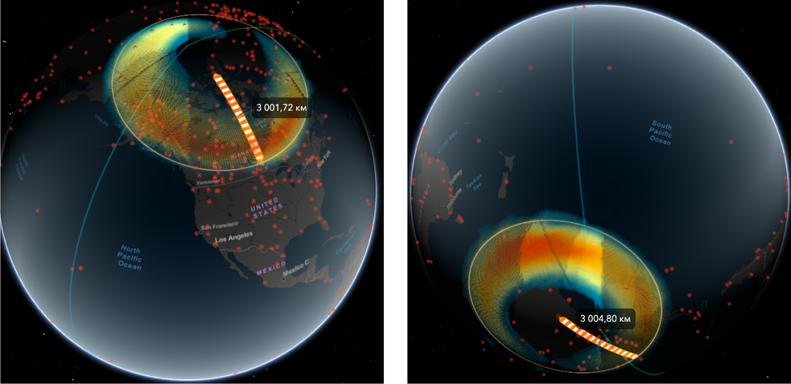
Figure 2. Visualization of auroras for the Northern (a) and Southern (b) hemispheres. An orange-white strip shows the option to measure the distance on the globe between any selected points.

![]()
Citation: Vorobev A. V., V. A. Pilipenko, R. I. Krasnoperov, G. R. Vorobeva, D. A. Lorentzen (2020), Short-term forecast of the auroral oval position on the basis of the ``virtual globe'' technology, Russ. J. Earth Sci., 20, ES6001, doi:10.2205/2020ES000721.
Copyright 2020 by the Geophysical Center RAS.
Generated from LaTeX source by ELXfinal, v.2.0 software package.