RUSSIAN JOURNAL OF EARTH SCIENCES, VOL. 20, ES6003, doi:10.2205/2020ES000714, 2020
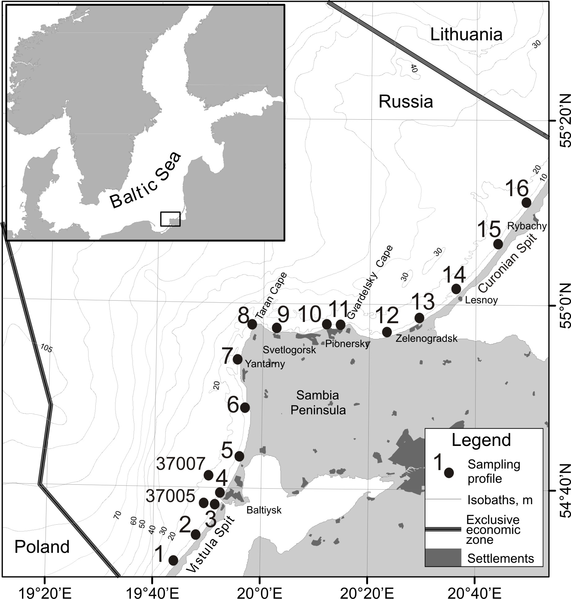
Figure 1. Study area and location of the sampling profiles. Each profile (point) included 4 samples at 0, 5, 10, and 15 m depth. The coordinates of the points are given in the supplement data [Krek, Ulyanova, 2020, Table 1].

![]()
Citation: Krek A., M. Ulyanova (2020), Mineral tracers of the alongshore sediment transport (example from the South-Eastern Baltic Sea), Russ. J. Earth Sci., 20, ES6003, doi:10.2205/2020ES000714.
Copyright 2020 by the Geophysical Center RAS.
Generated from LaTeX source by ELXfinal, v.2.0 software package.