RUSSIAN JOURNAL OF EARTH SCIENCES, VOL. 20, ES2007, doi:10.2205/2020ES000706, 2020
Ibrahem Yousef1, Vladimir P. Morozov1, Mohammad El Kadi2
1Institute of Geology and Petroleum Technologies, Kazan Federal University, Kazan, Russia
2Department of Geology, Damascus University, Damascus, Syrian Arab Republic
Using Scanning Electron Microscope SEM technics with XRD analyses, the authors have studied the influence and control of post-sedimentation changes on the upper Triassic (Mulussa F formation), and lower Cretaceous (Rutbah formation) reservoirs quality at Euphrates graben area. The detrital components occupy an average of 72% of the rock volume represented by sandstone quartz arenite, the authigenic minerals occupy an average of 20% represented by overgrowth quartz, kaolinite, chlorite, illite, illite-smectite mixed layers, dolomite, siderite, pyrite, and anhydrite. The history of post-sedimentation changes is subdivided into 2 stages; diagenesis-misocatagenis, and mesocatagenesis-apocatagenesis. The porosity of the reservoirs decreased due to the detrital clay, and the authigenic minerals which cause blocking of pore spaces, and reduce the diameter of the inter-pore channels and leads to a significant effect on the reservoir porosity. Quartz cement reduced the porosity of the upper Triassic reservoir to a lesser extent due to its low content 3%, while the other cements which consist mainly of kaolinite and siderite serve as the main factor in reducing the porosity since their content is higher 7.4%. In the lower Cretaceous reservoirs, quartz cement with the other cements equally contributed to decreasing the porosity due to their presence in equal volumes 2.8 to 3.6%. Houseknecht diagram shows that the initial porosity of the upper Triassic reservoir was reduced by compaction by 47.5%, while reduced by cementation by 26%. In the lower Cretaceous reservoir, the initial porosity was reduced by compaction by 59.5%, while reduced by cementation by 19%.
|
| Figure 1 |
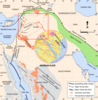
Syria is located on the northern flank of the Arabian plate (Figure 1). To the southwest and south, the Arabian plate is bounded by seafloor spreading along the Red Sea, Gulf of Aden, and Arabian Sea [Brew et al., 2001]. The Neogene and Quaternary volcanics were observed along with the western parts of the Arabian plate. The Arabian plate collided with the Eurasian plate along the Zagros and Bitlis sutures in southern Turkey [Barazangi et al., 1993]. The Bitlis suture, Zagros fold, and thrust belt, and the East Anatolian left-lateral strike-slip fault mark the collision zone (Figure 1). The current plate tectonic setting of the northern Arabian platform places Syria close to Arabia-Eurasia continental collision, with active plate boundaries occurring to the west, north, and east [Chaimov, 1993]. These plate boundaries include Zagros fold and thrust belt, Bitlis suture, North and East Anatolian faults, Dead Sea fault system, and Red Sea (Figure 1).
 |
| Figure 2 |
Four major tectonic zones occur in Syria: Palmyride foldbelt, Euphrates graben system, Abd El Aziz/Sinjar uplifts, and the Dead Sea fault system (Figure 2), [Brew et al., 2001]. The Euphrates graben system is one of the most important hydrocarbon basins in Syria and is recognized as a part of late Cretaceous rift structures developed in the eastern part of Syria. This structure is an aborted continental rift and is described as a junction between the Palmyrides folds belt and the Euphrates depression [Yousef et al., 2016]. It consists of a system of normal and strike-slip faults result of a transtensional regime during the late Cretaceous age. More than 400,000 barrels of light, sweet crude is estimated to be produced daily from the fields of the Euphrates graben [De Ruiter et al., 1995]. The bulk of hydrocarbons production at the Euphrates graben area are mainly from the lower Cretaceous sandstone reservoir (Rutbah formation), and from the upper Triassic sandstone reservoir (Mulussa F formation), [Syrian Petroleum Company SPC, 1981].
Both of Rutbah and Mulussa F reservoirs sediments consist of sandstone interbedded with claystone reflect deposition in fluvial to deltaic depositional environments [Yousef et al., 2019]. The hydrocarbons produced from the upper Triassic and lower Cretaceous reservoirs at Euphrates graben area account almost 60% of the total hydrocarbons reserved in the graben area and are considered an important resource for future exploration.
 |
| Figure 3 |
The study area is located in Euphrates graben in the eastern part of Syria (Figure 3a) and covers an area of about 18,000 km$^2$ (Figure 3b).
 |
| Figure 4 |
The sediments of the upper Triassic spread out along the Euphrates graben area with a thickness of 450 m, where the igneous sills are intruding, the thickness can be increased up to 550 m (Figure 4). The upper Triassic sediments consist mainly of floodplain claystone interbedded with mostly medium to fine-grained fluviatile sandstones. Lagoonal and shallow marine dolomitic shales and dolomite interbedded are present in the lower section of the upper Triassic sediments [Yousef and Morozov, 2017a, 2017b].
The upper Triassic sediments (Mulussa F formation) are subdivided on the basis of Spectral Gamma Ray logs and lithology composition from bottom to top into three zones [Yousef and Morozov, 2017c; Yousef et al., 2017]; (the lower zone/Mulussa F3 consist mainly of claystone that are usually rich in illite and show high potassium readings. The middle zone/Mulussa F2 consists mainly of sandstone interbedded with claystone that are usually rich in kaolinite and shows low potassium readings. The upper zone/Mulussa F1 consists of interbeds of sandstone and siltstone with claystone intervals that are dominated by illite, smectite, and illite-smectite mixed layers composition and show high potassium readings (Figure 4). The lower Cretaceous sediments (Rutbah formation) almost cover all the Euphrates graben area with thickness up to 350 m (Figure 4), they are composed largely of sandstone and claystone reflect coastal plain to shallow marine sediments. The lower Cretaceous sediments also are subdivided also from bottom to top into two zones; (lower zone/lower Rutbah, and upper zone/upper Rutbah), (Figure 4). Two major erosional surfaces are historically recorded at Euphrates graben fields [Koopman et al., 1999], they are Base Lower Cretaceous unconformity "BKL", and Base Upper Cretaceous unconformity "BKU" (Figure 4). These major erosional surfaces affected partially or completely the sediments of the upper Triassic and lower Cretaceous along the Euphrates graben [Yousef et al., 2018a]. Oil and gas are extracted mainly from the sandstone layers of the Mulussa F2, Mulussa F1, and the lower Rutbah zones, while the Mulussa F3 and the upper Rutbah zones don't form any reservoir rocks due to their lithofacies which contain a high percentage of clay materials.
Huge geoscience datasets were available for this work provided by Al-Furat Petroleum Company AFPC (Damascus, Syria) and represented mainly by core samples, well logs, and petrophysical laboratory analyses that are taken from 35 wells along the Euphrates graben fields with a present depth of 2000 to 4000 m MD (Measured Depth). The main studied wells are located at the center and the margins of the graben area due to the varying quantity and quality of the studied samples. The location of the main studied wells is shown in (Figure 3b). All samples were studied using a series of petrographical and petrological analyses, these include studying the thin sections used the polarized microscope which allows the user to evaluate the rock fabric, and the porosity types of the sandstones studied samples. Scanning Electron Microscope SEM technics also were applied for many selected samples for the purposes of studying the diagenetic and authigenic minerals and their distribution within the pore space system. X-Ray Diffraction XRD analyses (whole sandstone sample and $< 2 \;\mu$m clay fraction) also were used for many samples to provide quantitative estimates of the mineral composition of the studied reservoirs rocks.
 |
| Figure 5 |
 |
| Figure 6 |
 |
| Table 1 |
Based on the petrographic studies, the classification of the upper Triassic and lower Cretaceous sandstone were carried out according to the scheme of [McBride, 1963] shown in Figure 5. The red points in the scheme show the compositions of the studied samples from the reservoir sediments which consist mainly of sandstones. Among them, the quartz arenite is the most common. Optical microscopic observations together with XRD analysis (whole sandstone sample) (Figure 6), (see Table 1), showed that the detrital quartz components occupy an average of 72% of the rock volume.
 |
| Figure 7 |
Based on the petrographically investigations, the sandstone of the upper Triassic and lower Cretaceous reservoirs are classified according to the scheme of [McBride, 1963] as quartz arenite (Figure 7a) with an exception of that samples which contain more than 20% sedimentary mudstone clasts and therefore are classified as lithic arenite (Figure 7b). Other sandstone samples are dominated by up to 12% of dolomite materials (see Table 1) that form the main cement between the detrital grains and partially or completely plugged the pore spaces between the detrital grains (Figure 7c).
Siderite content also can be reached up to 22% in some sandstone samples (see Table 1), siderite also can be as cement materials between the detrital grains, or as sphaerosiderite of 100 $\mu$m in size (Figure 7d). Most of the quartz grains are rounded to sub-rounded with different degrees of classification vary from well to moderately to bad classification, grains size varies from 250 to 500 $\mu$m, some coarse-grained sandstones are with micro-fractures (Figure 7c and Figure 7e). Among the quartz fragments, monocrystalline predominate (70%), less often polycrystalline (20%). Feldspars in sandstones are rare (maximum 3%) and mainly represented by potassium feldspar. During the sediments burial processes, most of the feldspar become unstable and are partially or completely converted to kaolinite [Yousef et al., 2017]. In some samples, feldspars are dissolved and replaced by pyrite (Figure 7e), or by kaolinite. Among the accessory grains, heavy minerals are founded, represented by tourmaline and zircon and authigenic anatase in some samples (Figure 7f). The pore spaces of the sandstone are formed mainly by the intergranular porosity, they are moderate to well connect by channels (Figure 7a and Figure 7e), some pores are filled with detrital clay materials or with authigenic minerals or types of cement, other pores are unfilled.
 |
| Table 2 |
The petrographical studies with the help of SEM observations and XRD analysis ($< 2 \;\mu$m clay fraction samples) showed that the authigenic minerals in the upper Triassic and lower Cretaceous sandstone occupy an average of 20% of the rock volume. These include; authigenic quartz or overgrowth quartz, kaolinite, illite, smectite, chlorite, illite-smectite mixed layers, dolomite, siderite, pyrite, and anhydrite (Table 2).
 |
| Figure 8 |
Authigenic quartz; occupying from 1 to 13% of the sandstone volume, depending on SEM observations, such this overgrowth quartz is represented by microcrystalline elongated pyramidal idiomorphic crystals having a dimension of about 30 to 70 $\mu$m, they grow on the surfaces of the detrital quartz grains, or fills the intergranular pore spaces (Figure 8a and Figure 8b). It can be considered in some samples that the authigenic quartz plays the role of radial syntactic cement that connect the detrital grains and clogs the intergranular pores, thereby reducing the sandstone porosity and pore connectivity of the pores network.
Kaolinite; content up to 12% of the whole sandstone samples (see Table 1), and up to 82% in the $< 2 \; \mu$m clay fraction samples (see Table 2). Kaolinite is common in the sediments of the Mulussa F2 zone (see Figure 4). As a result of SEM studies, two morphological types of kaolinite were founded; Pseudo-hexagonal kaolinites founded in the form of pore-filling material consist of well to moderately crystallized crystals of 5 to 15 $\mu$m in size (Figure 8c). Booklets of kaolinite are well to developed, subhedral to euhedral blocky of crystals and clusters of 20 to 50 $\mu$m in size partially or completely filled the primary and secondary pore spaces between the detrital grains (Figure 8d).
Chlorite; content up to 13% (see Table 2), chlorite is not common in the studied sandstone sediments such as the kaolinite or the illite. Where the chlorite present, it occurs in the form of pores fillings or linings, consists of cabbage head-like morph and euhedral individual plates vary from 5 to 10 $\mu$m, with random orientation on the surfaces of detrital grains enclosing the authigenic quartz and filling or lining the pores (Figure 8e and Figure 8f).
Illite; content from 1 to 23% in the $< 2\: \mu$m clay fraction samples (see Table 2), it is common in sediments of the Mulussa F3 and Mulussa F1 zones (see Figure 4). SEM examination identified two forms of illite; Illite as grain-coatings developed around and on the surfaces of the quartz grains partially or completely coatings them. Illite as pore-fillings in the form of fillings or linings pores, as well as in the form of short-fiber aggregates ranges in size from 5 to 10 $\mu$m, firmly attached to the pore walls (Figure 8g).
Illite-smectite mixed layers; content up to 7% (see Table 2). SEM examination identified two forms of the illite-smectite mixed layers; illite-smectite mixed layers as grain-coatings; developed around and on the surfaces of the quartz grains as platy or wispy edges crystals ranging in size from 2 to 10 $\mu$m (Figure 8h).
Illite-smectite mixed layers as pore fillings; developed in the pore spaces and forms bridges between the detrital grains and significantly reducing the porosity and the permeability of the sandstone layers.
 |
| Figure 9 |
Dolomite; occurs especially near the top and bottom of the Mulussa F reservoir sediments (see Figure 4), and occupying between traces up to 12% according to the results of XRD (whole sandstone sample) (see Table 1). Most of the dolomite is found in the form of poikilotopic cement consisting of anhedral to subhedral aggregated and crystals vary in size from 10 to 50 $\mu$m filling or occluding the pore spaces (Figure 9a).
Siderite; is common in the sediments of Mulussa F2 and Mulussa F1 zones, and content up to 23% (the whole sandstone sample) (see Table 1). Most of the siderite occurs in the form of cement between the detrital grains, or as sphaerosiderite of about 50 $\mu$m in size (see Figure 7d). Some siderite occurs as overgrowth crystals in the pore spaces, or as cleaved masses of 10 to 50 $\mu$m in size partially occluded the macropores (Figure 9b).
Pyrites; content from traces up to 1% (see Table 1), and often found in the form of micro poikilotopic patches replacing clay minerals (see Figure 7e), or as isolated micro spherical nodules of 5–10 $\mu$m in the primary and secondary pores (Figure 9c).
Anhydrite; occurs in traces amounts up to 2% (see Table 1), and forms poikilotopic patches of cement that connects the detrital grains and filling the pore spaces (Figure 9d).
 |
| Figure 10 |
The petrographical analyses and investigations along with SEM observations discussed here to identify the post-sedimentation changes history of the upper Triassic and lower Cretaceous sediments in Euphrates graben area, and discern the growth of the various types of cement and authigenic minerals. The history of post-sedimentation changes is subdivided into 2 stages; diagenesis-misocatagenis stage and mesocatagenesis-apocatagenesis stage, every stage is subdivided into 2 phases (Figure 10).
It is believed that the diagenesis-misocatagenis stage includes the following processes; infiltration of detrital clay, the formation of early carbonate, formation and dissolution of potassium feldspar, precipitation and formation of kaolinite, precipitation of chlorite, the formation of pyrite, and the formation of siderite. It should be noted that the compaction and dissolution started at the beginning of the diagenesis-misocatagenis stage and continue until the end of the mesocatagenesis-apocatagenesis stage. During the mesocatagenesis-apocatagenesis stage, it is believed that the following processes are taken place; the formation of growths quartz, precipitation of illite, precipitation illite-smectite mixed layers, formation of dolomite, precipitation of sulfate cements anhydrite and barite, in addition, the following events are continued during the mesocatagenesis-apocatagenesis stage; dissolution of potassium feldspar, precipitation of kaolinite, precipitation of chlorite, the formation of pyrite, and the formation of siderite (Figure 10).
 |
| Figure 11 |
Clay minerals, according to XRD analysis, are mainly represented by kaolinite, illite, chlorite, and illite-smectite mixed-layers. The porosity and permeability of the upper Triassic and lower Cretaceous sandstone reservoirs decreased due to the infiltration of detrital clay materials, and due to the authigenic kaolinite, chlorite, illite, and illite smectite mixed layers that filled the pore spaces and cements the detrital grains (Figure 11). The most important authigenic phase is the kaolinite because it is the most common between the clay minerals in the upper Triassic and lower Cretaceous sandstone reservoirs. The higher kaolinite content is found in clayey sandstone lithofacies, while the lower kaolinite content is found in the medium-grained and coarse-grained sandstone lithofacies. The authigenic kaolinite that founded in the sandstones almost has a well-crystallized variety, often found in the form of booklets and vermiculite-like aggregates, as well as discrete crystals (Figure 11a and Figure 11b). The micro-porosity of the kaolinite aggregates depends on their size, in the large aggregates that are range from 100 up to 300 $\mu$m in size, the pore sizes are ranges from 0.56 to 1.8 $\mu$m in dominate, smaller aggregates of kaolinite that are less than 100 $\mu$m have pore sizes of 0.09 $\mu$m. Kaolinites have significant differences in the morphology and the size of the crystals and booklets that found between the detrital grains. The crystals and booklets of kaolinite can be distinctly elongated or form dense aggregates with poorly distinguishable grain outlines (Figure 11b). As a result, it can be assumed that the existence of the kaolinite inside the pore spaces as a whole play the role of a factor in reducing the porosity and permeability of the sandstone reservoirs since they act as a factor in reducing the pore size and the size of the inter-pore channels (Figure 11a and Figure 11b). The presence of chlorite has a less significant effect on the porosity and permeability of the studied sandstone reservoirs, due to their less common in the sandstone reservoirs.
 |
| Figure 12 |
In the studied sandstone reservoirs, the authigenic chlorite is a common mineral in the form of pore fillings, and less is observed in the form of grains coatings (Figure 11c and Figure 11d). The occurrence of the chlorite in the form of randomly distributed idiomorphic plate crystals with a diameter of 5 $\mu$m in the pore spaces affects the permeability of the reservoirs more than the porosity since their appearance in this form reduces the ability of the fluid to move through the pores network. Illite and illite-smectite mixed-layers are present in the sandstone as a pore filling, or as grains coatings, these minerals play an important role in reducing the porosity and permeability of the reservoirs. The appearance of illite in the pore spaces as tangled fibrous masses reduces the porosity of the sandstone due to their partial or complete filling of the pore space (Figure 11e and Figure 11f). The appearance of illite and illite-smectite mixed layers as pores bridges between the detrital grains leads to a breakdown of the pore connectivity which further reduces the permeability of the reservoirs. The known ability of the smectite packets to adsorb water between silicate layers in many cases increases their initial volume, therefore, they affect the porosity and permeability of the reservoirs by closing the pore spaces, which is considered as a negative factor, especially for oil and gas development activities [Yousef et al., 2017, 2018b]. The effects of the clay minerals content (XRD data results) on the porosity and permeability of the upper Triassic and lower Cretaceous sandstone reservoirs is shown in (Figure 12a and Figure 12b).
The graph in Figure 12a showing the relationship between the clay minerals content and the porosity and permeability of the upper Triassic sandstone reservoir (Mulussa F reservoir), here, it is clear that approximately below the depth of 3200 m, the porosity of the sandstone reduced down, this is due the higher percent of the clay minerals (epically the kaolinite) within the sandstone below this depth, the effect of the other clay minerals such as chlorite, illite, and illite-smectite mixed layers is lower compared to the kaolinite. Also, this reduction in the porosity is due to the influences of the cementation and compaction which will discusses in more details in paragraph 4.5.
The graph in Figure 12b showing the relationship between the clay minerals content and the porosity and permeability of the lower Cretaceous sandstone reservoir (Rutbah reservoir), here, it is clear that approximately below the depth of 2800 m, the porosity of the sandstone reduced down, this is due the higher percent of the clay minerals epically the kaolinite, illite, and illite-smectite mixed layers within the sandstone below this depth.
 |
| Figure 13 |
In general, the development of the cementation processes on the upper Triassic and lower Cretaceous sandstone reservoirs are moderate to strong. The primary cementing materials are the siliceous and the clayey materials (mainly kaolinite) (Figure 13a). Authigenic or overgrowth quartz often found in the form of crystals vary in size from 10 to 30 $\mu$m (Figure 13b). Quartz overgrowth is more developed in the sediments in which a relatively high contents of detrital quartz grains are founded. The development of the quartz overgrowth can cause blocking of pores, or reducing the diameter of the inter-pore channels which has a significant effect on the porosity of the reservoirs. Overgrowth quartz, like cement, in some cases completely covers the space between the detrital quartz grains (Figure 13b). Clay cement are abundant, including kaolinite, illite and mixed layers of illite-smectite. Among them, kaolinite is the most widespread (Figure 13c). Carbonates cement are limited in the studied sandstone and mainly consist of authigenic calcite, and dolomite in some intervals (Figure 13e), siderite cement also exists in some samples and form the main cement materials between the sandstone grains especially in the sediments of the Mulussa F2 zone (Figure 13d). Early carbonates cement plays a role factor in increasing the porosity of the reservoirs due to their dissolution at the mesocatagenesis-apocatagenesis stage. The late stage of the cementation with carbonates or sulfate cements leads to the filling of the intergranular pores, reducing the properties of the reservoirs. Anhydrite, barite, and pyrite cements are less distributed and are often present in varying amounts in the sandstone where they clog the pores between the detrital grains (Figure 13f).
In the process of studying the effects of the different types of cements on the reservoir properties of the upper Triassic and lower Cretaceous sandstone, cements were classified into three types: total cement, quartz cement, and other cements (kaolinite, dolomite, siderite, barite, anhydrite, and pyrite) (Figure 13a). The purpose of this classification is to determine which of those cements plays the main factor in reducing the porosity of the reservoirs. The terms that are used in this section include:
The purpose of studying the distribution of the different types of cements in the studied sediments is to determine the relationship between the reservoir properties and the percentage of the cements, and to determine the type of the main cement which plays the role of the main factor in reducing the quality of the reservoir rocks. Content of total cement in the Mulussa F reservoir (Figure 13a), (average 10.4%), quartz cement content (average 3.0%), other cements (average 7.4%), intergranular volume (average 20.9%), and the intergranular porosity (average 10.8%). Hence, it can be assumed that cementation is a strong factor in reducing the porosity of the Mulussa F reservoir rocks because most of the intergranular volume are filled with cements. Quartz cement reduced the porosity of the reservoir rocks to a lesser extent due to its low content (3%), while the other cements which are practically in the Mulussa F reservoir rocks consist mainly of kaolinite and siderite serve as the main factor in reducing the porosity, since their content is higher (7.4%). Content of total cements in the Rutbah reservoirs (Figure 13a) (average 7.6%), quartz cement (average 2.8%), other cements (average 3.6%), intergranular volume (average 16.2%), and the intergranular porosity (average 8.6%). Hence, it can be assumed that cementation plays the factor in reducing the porosity in Rutbah reservoir, because part of the intergranular volume is filled with cements. Quartz cement with other cements equally contributed to decrease the porosity of reservoir due to their presence in equal volumes (2.8 to 3.6%).
 |
| Figure 14 |
 |
| Figure 15 |
The horizontal axis of the diagram can be used to calculate the percentage of the initial porosity that have been reduced by the cementing processes, this value can be quantified using the following equation:
\begin{eqnarray*} \mbox{Porosity reduced by cementation} = \end{eqnarray*} \begin{equation} \tag*{(2)} \mbox{total cement} / (40 \times 100) \end{equation}As shown by the dashed line in the diagram (Figure 14 and Figure 15), the intergranular porosity of the sandstone depends on how much the intergranular volume was reduced by the compaction processes (vertical axis), and how much of this intergranular volume was reduced by the cementation processes (horizontal axis). The intergranular porosity can be estimated either directly from the diagram, or using the following equation:
\begin{eqnarray*} \mbox{Intergranular porosity} = \end{eqnarray*} \begin{equation} \tag*{(3)} \mbox{intergranular volume} - \mbox{total cement} \end{equation}The porosity of the sandstone reservoirs may be predominantly as a function of compaction processes, or as a function of cementation processes, or maybe as a function of both compaction and cementation. The dashed diagonal line in the diagram separates the samples in which compaction was more important than cementation. For example, if the porosity of the sandstone as a compaction function, then the samples will be located in the lower-left, while if the porosity of the sandstone is a cementation function, then the samples will be closer in the upper-right (Figure 14 and Figure 15).
If the porosity of the sandstone is a function of both compaction and cementation, then, in this case, the samples in the diagram will be in the middle part of the diagram (Figure 14 and Figure 15). Thus, when individual samples are plotted on this diagram, a quick assessment can be made of the relative importance of compaction and cementation in determining reservoir quality. The development of the intergranular porosity in the Mulussa F reservoir is shown in (Figure 14), 60% of the data shown in the diagram are located in the lower-left part of the diagram (compaction dominant), while 40% of the data are located in the upper-right part of the diagram (cementation dominant). This indicates that the sandstone from the Mulussa F reservoir has undergone a significant decrease in the porosity due to the compaction processes more than the decrease in porosity by the cementation processes. The average value of the intergranular volume for all the data of the diagram indicated by the star (Figure 14) is 20.9%, and the average value of the total cement is 10.4%. If we assume that the average initial porosity of the Mulussa F reservoir was 40%, then the initial porosity was reduced by compaction by 47.5% (using (1)), while the initial porosity was reduced by cementation by 26% (using (2)). Petrographic observations confirm that most of the grains exhibit concave-convex or stitched contacts, or both together. The average intergranular porosity of the Mulussa F reservoir in the diagram (Figure 14) is 10.5% (using (3)), this value corresponds to the real values obtained from the data analysis.
The development of the intergranular porosity in the Rutbah reservoir is shown in (Figure 15), 85% of the data on the diagram are located in the lower-left part of the diagram (dominant of compaction), and 15% of the data are located in the upper-right corner of the diagram (dominance of cementation), which indicates that the sandstone from Rutbah reservoirs has undergone a significant decrease in porosity due to the compaction processes is greater than the decrease in porosity by the cementation processes. The average value of the intergranular volume for all the data indicated by the star in the diagram (Figure 15) are 16.2%, and the average value of the total cement is 7.6%. It is assumed that the initial porosity of the Rutbah reservoir was 40%. Then 59.5% of the initial porosity was reduced by compaction processes (using (1)), while 19% of the initial porosity was reduced by cementation processes (using (2)). The average intergranular porosity of the Rutbah reservoir in the diagram (Figure 15) is 8.6% (using (3)), this value corresponds to the real values obtained from the analysis of the main data.
 |
| Figure 16 |
Compaction prevails in the upper Triassic and lower Cretaceous sandstone and is considered as one of the main post-sedimentation factors that regulate the porosity of the reservoirs and cussed a decrease in the radii of the pore channels (Figure 16a). The compaction of the siltstone and fine-grained sandstones is important because the finer material present between the coarse grains and significantly reduced the initial porosity.
In this study, sandstone show three types of granular contacts, which include point, linear, and concave-convex contacts. Compaction is limited in the sandstone that cemented by abundant authigenic silica or carbonate cementation. Microcrack porosity caused by compaction is present in those areas where grains were deformed during compaction (Figure 16a). Microcracks in grains can improve permeability, especially when the space between debris is cemented or filled with clay minerals [Worden and Burley, 2003]. In some samples studied, compaction leads to the formation of microcracks, which are later filled with authigenic clay minerals, which leads to a decrease in sandstone porosity (Figure 16b). The abundance of deformed grains in the studied sandstone indicates that a decrease in the primary intergranular porosity began shortly after sedimentation. The relationship between porosity and diagenesis-misocatagenis and mesocatagenesis-apocatagenesis for the Mulussa F and Rutbah reservoirs is shown in (Figure 16c and Figure 16d). After the deposition processes, the porosity of the reservoirs is reduced due to the continuation of the sedimentation. During the diagenesis-misocatagenis stage, the main processes were the mechanical compaction and the cementation which led to a decrease the porosity of the reservoirs. During the mesocatagenesis-apocatagenesis stage, the main processes that affect the reservoir rocks also were compaction, cementation, while the dissolution led to increasing the porosity of the reservoirs (Figure 16c, Figure 16d, Figure 16e and Figure 16d). Dissolution in the sediments of upper Triassic and lower Cretaceous was mainly manifested as dissolution of calcite cement and feldspar (Figure 16e and Figure 16f). The dissolution improves the porosity of the reservoirs, the reason for the dissolution was the large amount of the organic acid and CO$_2$ that formed during the maturation of the organic matter during the burial history of the sediments. Most of the secondary porosity is the result of the partial or complete dissolution of the calcite cement (Figure 16e and Figure 16f). The dissolution of the detrital feldspar also occurred. Since the content of the feldspar was low, and most of the porosity formed in the feldspar is inside the grains, the consequences of the dissolution of feldspar did not significantly improve the quality of the reservoir rocks. In addition, most of the dissolved feldspar is replaced by kaolinite or by the other authigenic minerals during the mesocatagenesis-apocatagenesis stage. Dissolution markedly improved the reservoir properties, especially in the upper and lower parts of the upper Triassic reservoir, where carbonate cements are common (see Figure 4).
 |
| Figure 17 |
The porosity of Mulussa F and Rutbah reservoirs are mainly controlled by the characteristics of the sedimentation conditions, and by the processes during the diagenesis-apocatagenesis stages. Based on SEM observations along with petrographical interpretations, the evolution of the pore space of the Mulussa F and Rutbah sandstone reservoirs have been summarized in this paragraph (Figure 17).
Based on petrography study using the technics of Scanning Electron Microscope SEM, and XRD analyses, the influence, and control of post-sedimentation changes on the upper Triassic and lower Cretaceous sandstone reservoirs quality were studied and reported. The XRD analyses showed that the detrital components occupy an average of 72% of the rock volume, consist mainly of sandstone quartz arenite. SEM studies show that the authigenic minerals occupy an average of 20% of the rock volume, these include overgrowth quartz, kaolinite, chlorite, illite, illite-smectite mixed layer, dolomite, siderite, pyrite, and anhydrite. Based on petrography interpretation, the history of the post-sedimentation changes is divided into 2 stages; diagenesis-misocatagenis, and mesocatagenesis-apocatagenesis. The porosity of the upper Triassic and lower Cretaceous sandstone reservoirs decreased due to the infiltration of the detrital clay materials during the deposition, in addition, the authigenic minerals which cause pore spaces blocking and reduce the diameter of the inter-pore channels. It the upper Triassic reservoir, the overgrowth quartz cement reduced the porosity of the sandstone to a lesser extent due to its low content (3%), while the other cements which consist mainly of kaolinite and siderite serve as the main factor in reducing the porosity since their content is higher (7.4%). In the lower Cretaceous Rutbah reservoir, the overgrowth quartz cement with other cements equally contributed to decreasing the porosity of the reservoir due to their presence in equal volumes (2.8 to 3.6%). Using the diagram of Houseknecht to evaluate the influence and control of the cementation and compaction on the reservoir porosity, it shows that the initial porosity of the upper Triassic reservoir was reduced by compaction by 47.5%, while reduced by cementation by 26%. Using the diagram of Houseknecht for the lower Cretaceous reservoir is shown that the initial porosity was reduced by compaction by 59.5%, while reduced by cementation reduced by 19%.
Barazangi, M., D. Seber, T. Chaimov, et al. (1993) , Tectonic evolution of the northern Arabian plate in Western Syria, Recent Evolution and Seismicity of the Mediterranean Region, 402, p. 117–140, https://doi.org/10.1007/978-94-011-2016-6_5.
Brew, G., M. Barazangi, A. K. Al-Maleh, et al. (2001) , Tectonic and Geologic Evolution of Syria, Geo Arabia, 6, no. 4, p. 573–616.
Chaimov, T., M. Barazangi, D. Al-Saad, et al. (1993) , Seismic fabric and 3-D upper crustal structure of the southwestern intracontinental Palmyride fold belt, Syria, American Association of Petroleum Geologists (AAPG Bulletin), 77, no. 12, p. 2032–2047, https://doi.org/10.1306/BDFF8FC4-1718-11D7-8645000102C1865D.
De Ruiter, R. S. C., P. E. R. Lovelock (1995) , The Euphrates Graben of eastern Syria: A new petroleum province in the northern Middle East, Geo Arabia: Middle East Petroleum Geosciences, 94, p. 357–368.
Houseknecht, D. W. (1984) , Influence of grain size and temperature on intergranular pressure solution, quartz cementation, and porosity in quartzose sandstone, Journal of Sedimentary Petrology, 54, no. 2, p. 348–361, https://doi.org/10.1306/212F8418-2B24-11D7-8648000102C1865D.
Houseknecht, D. W. (1988) , Intergranular pressure solution in four quartzose sandstones, Journal Sedimentary Petroleum, 58, no. 2, p. 228–246, https://doi.org/10.1306/212F8D64-2B24-11D7-8648000102C1865D.
Koopmans, M. P., W. I. C. Rijpstra, M. M. Klapwijk, et al. (1999) , A thermal and chemical degradation approach to decipher pristane and phytane precursors in sedimentary organic matter, Organic Geochemistry, 30, no. 9, p. 1089–1104, https://doi.org/10.1016/S0146-6380(99)00088-1.
McBride, E. F. (1963) , Classification of common sandstones, Journal of Sedimentary Petrology, 33, no. 3, p. 661–669, https://doi.org/10.1306/74D70EE8-2B21-11D7-8648000102C1865D.
Syrian Petroleum Company, SPC (1981) , On the status of hydrocarbon exploration in Syrian Arab Republic during 1971–1980, Hydrocarbon Exploration Seminar, p. 91–121, Organization of Arab Petroleum Exporting Countries, Kuwait.
Worden, R. H., D. S. Burley (2003) , Sandstone diagenesis: the evaluation of sand to stone, International Association of Sedimentologists, Blackwells, Oxford, 2, p. 3–44.
Yousef, I. M., V. P. Morozov (2017a) , Characteristics of upper triasic sandstone reservoirs in syria using analysis of laboratory methods, Georesursy, 19, no. 4, p. 356–363, https://doi.org/10.18599/grs.19.4.8.
Yousef, I. M., V. P. Morozov (2017b) , Characterization of Upper Triassic Sandstones Using Sem, Xrd and Xrf Analysis, Revista Publicando, 4, no. 13, p. 264–282.
Yousef, I., V. P. Morozov (2017c) , Structural and mineralogical characteristics of the clay minerals in upper Triassic sandstone reservoir, Euphrates graben, east Syria, Neftyanoe Khozyaystvo – Oil Industry, 8, p. 68–71, https://doi.org/10.24887/0028-2448-2017-8-68-71.
Yousef, I., V. Morozov, M. Al-Kadi (2016) , Sedimentological review of upper triassic (Mulussa F formation) in Euphrates-Graben Syria, Journal of Engineering and Applied Sciences, 11, no. 14, p. 3067–3079.
Yousef, I., S. Usmanov, V. Morozov, et al. (2017) , Diagenetic chlorite, illite and illite-smectite minerals in sandstone reservoir; structural, morphology and precipitation upper triassic reservoir, Syria, International Multidisciplinary Scientific GeoConference Surveying Geology and Mining Ecology Management, SGEM, 17, no. 15, p. 115–124, https://doi.org/10.5593/sgem2017H/15/S06.015.
Yousef, I., V. Sudakov, V. Morozov, et al. (2018a) , Structural setting and zonal distribution of upper triassic-lower cretaceous reservoirs in the syrian euphrates graben, International Multidisciplinary Scientific GeoConference Surveying Geology and Mining Ecology Management, SGEM, 18, no. 1.4, p. 811–818, https://doi.org/10.5593/sgem2018/1.4/S06.106.
Yousef, I., V. Sudakov, V. Morozov, et al. (2018b) , Diagenetic clay minerals and reservoir quality of the upper triassic sandstone in euphrates graben, East of Syria, International Multidisciplinary Scientific GeoConference Surveying Geology and Mining Ecology Management, SGEM, 18, no. 1.4, p. 397–404, https://doi.org/10.5593/sgem2018/1.4/S06.052.
Yousef, I., M. Shipaeva, V. Morozov, et al. (2019) , Lithofacies analysis and depositional environments of the upper triassic and lower cretaceous sediments in euphrates graben Syria, International Multidisciplinary Scientific GeoConference Surveying Geology and Mining Ecology Management, SGEM 2019, 19, no. 1.1, p. 279–286, https://doi.org/10.5593/sgem2019/1.1/S01.034.
Received 16 January 2020; accepted 11 March 2020; published 28 April 2020.

Citation: Yousef Ibrahem, Vladimir P. Morozov, Mohammad El Kadi (2020), Influence and control of post-sedimentation changes on sandstone reservoirs quality, example, upper Triassic (Mulussa F reservoir), and lower Cretaceous (Rutbah reservoir), Euphrates graben, Syria, Russ. J. Earth Sci., 20, ES2007, doi:10.2205/2020ES000706.
Copyright 2020 by the Geophysical Center RAS.