RUSSIAN JOURNAL OF EARTH SCIENCES, VOL. 20, ES2001, doi:10.2205/2020ES000704, 2020
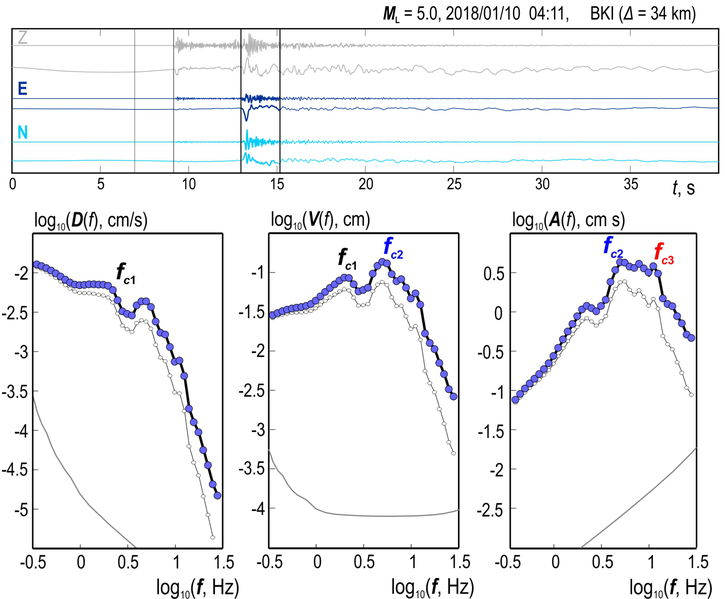
Figure 3. Processing of S wave records, earthquake of 2018.01.10 at 04.11, $M_{L} = 5.0$, $r= 34$ km, $H = 39$ km. A copy of the dialog box is given. From top to bottom: A0(t) and D0(t) for the Z, E, and N components are given, BKI station. The segments of the S group and noise are indicated by pairs of vertical lines. Below, there are graphs of the spectra displacement, velocity, and acceleration. Curves in three boxes, from bottom to top: noise spectrum, observed spectrum, and recovered spectrum

![]()
Citation: Skorkina Anna A. (2020), Scaling of two corner frequencies of source spectra for earthquakes of the Bering fault, Russ. J. Earth Sci., 20, ES2001, doi:10.2205/2020ES000704.
Copyright 2020 by the Geophysical Center RAS.
Generated from LaTeX source by ELXfinal, v.2.0 software package.