RUSSIAN JOURNAL OF EARTH SCIENCES, VOL. 20, ES2001, doi:10.2205/2020ES000704, 2020
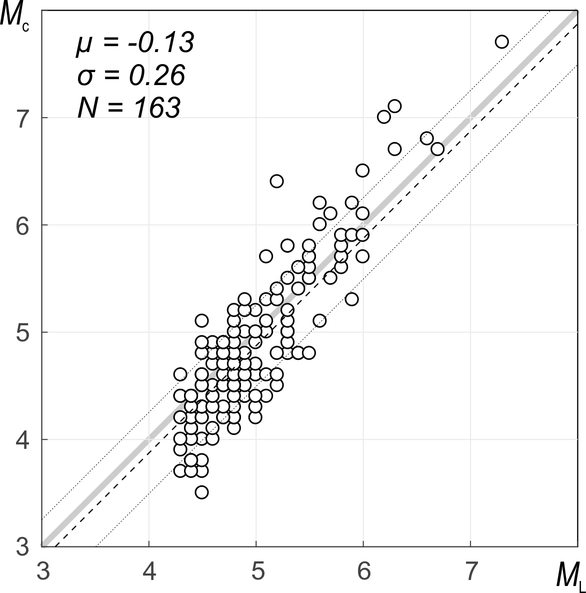
Figure 2. Relationships between regional and coda magnitudes ($M_{L}$ and $M_{c}$), for the area of study; estimates obtained during 2011–2018 for $M_{L} > $ 4 are compared. The average relationship is given by solid line $y = x + {\rm const}$, where ${\rm const} = \mu$, dashed-dotted lines are graphs with ${\rm const} = \mu\pm\sigma$, where $\sigma$ is standard deviation. Solid grey line corresponds to 1 : 1 type of relationship (when $M_{L} = M_{c}$). Shown in left upper corner values of $\mu$, $\sigma$ obtained by data approximation using linear orthogonal regression with fixed $b = 1.0$.

![]()
Citation: Skorkina Anna A. (2020), Scaling of two corner frequencies of source spectra for earthquakes of the Bering fault, Russ. J. Earth Sci., 20, ES2001, doi:10.2205/2020ES000704.
Copyright 2020 by the Geophysical Center RAS.
Generated from LaTeX source by ELXfinal, v.2.0 software package.