RUSSIAN JOURNAL OF EARTH SCIENCES, VOL. 20, ES1005, doi:10.2205/2020ES000693, 2020
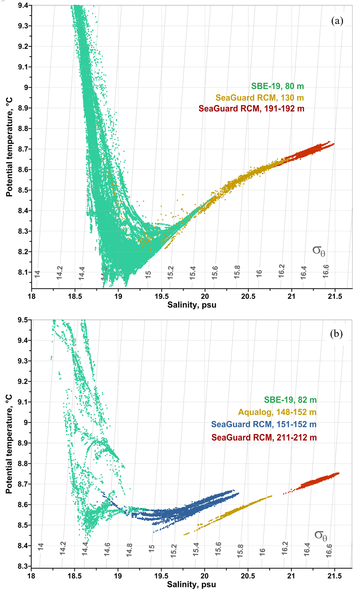
Figure 8. $T-S$ diagram for the BBL according to the following data: a) SeaBird 19plus at 80 m (green dots), SeaGuard at 130 m (yellow dots) and 192 m (red dots); b) SeaBird 19plus at 82 m (green dots), SeaGuard at 152 m (blue dots) and 212 m (red dots), Aqualog at 152 m (the installation depth is 220 m, only the data from 152 m are used; yellow dots).

![]()
Citation: Zatsepin A. G., V. V. Kremenetskiy, O. I. Podymov, A. G. Ostrovskii (2020), Study of the effects of Ekman dynamics in the bottom boundary layer on the Black Sea continental slope, Russ. J. Earth Sci., 20, ES1005, doi:10.2205/2020ES000693.
Copyright 2020 by the Geophysical Center RAS.
Generated from LaTeX source by ELXfinal, v.2.0 software package.