RUSSIAN JOURNAL OF EARTH SCIENCES, VOL. 20, ES1005, doi:10.2205/2020ES000693, 2020
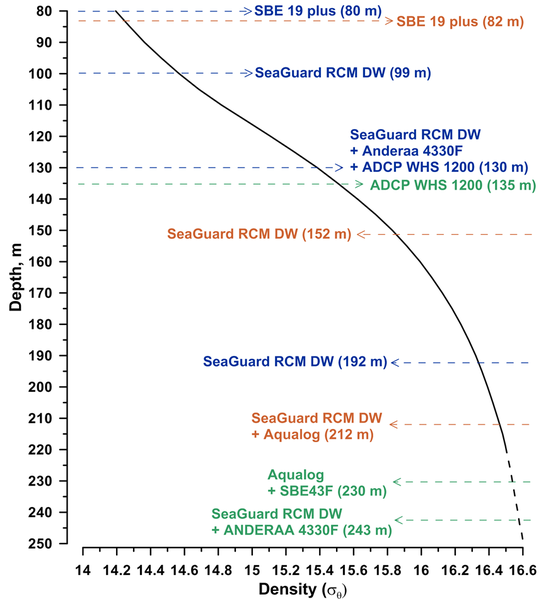
Figure 3. The average density profile, according to the Aqualog data collected during the cold season of 2015–2016, and installation depths of the bottom stations in 2018–2019. Blue color – first installation (14/02/2018–16/04/2018), green – second (31/10/2018–15/12/2018), brown – third (10/02/2019–11/04/2019).

![]()
Citation: Zatsepin A. G., V. V. Kremenetskiy, O. I. Podymov, A. G. Ostrovskii (2020), Study of the effects of Ekman dynamics in the bottom boundary layer on the Black Sea continental slope, Russ. J. Earth Sci., 20, ES1005, doi:10.2205/2020ES000693.
Copyright 2020 by the Geophysical Center RAS.
Generated from LaTeX source by ELXfinal, v.2.0 software package.