RUSSIAN JOURNAL OF EARTH SCIENCES, VOL. 20, ES1004, doi:10.2205/2019ES000699, 2020
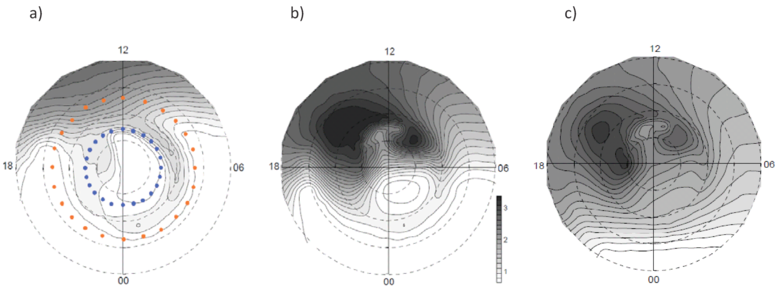
Figure 4. Contour map of $N_mF2$ (in $10^{11}$ m$^{-3}$, the gray scale is common for all three plots) for (a) January, 2008, (b) March and (c) July, 2007. The location of the ESR and the SGO ionosonde in each MLT hour is marked by blue and orange dots, respectively.

![]()
Citation: Lukianova Renata , Alexander Kozlovsky (2020), Electron density in the polar F region ionosphere during solar minimum: modeling, radar and ionosonde observations, Russ. J. Earth Sci., 20, ES1004, doi:10.2205/2019ES000699.
Copyright 2020 by the Geophysical Center RAS.
Generated from LaTeX source by ELXfinal, v.2.0 software package.