RUSSIAN JOURNAL OF EARTH SCIENCES, VOL. 20, ES1004, doi:10.2205/2019ES000699, 2020
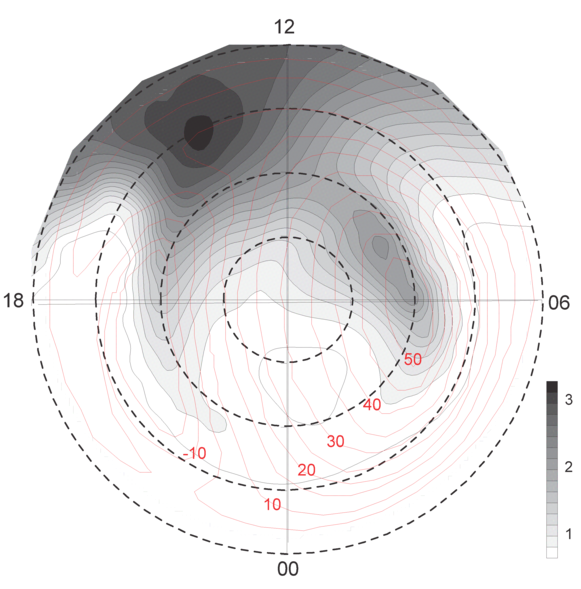
Figure 3. Map of $N_mF2$ (in gray scale, $10^{11}$ m$^{-3}$) superimposed on the trajectories of plasma convection (red lines; the contour intervals are 5 kV). Model input parameters: IMF $B_z = -5 $ nT, $B_y = 0$, $V_{\mathrm{SW}} = 400$ km/s, $DOY = 360$, $Kp = 2$, $F10.7 = 80$, UT = 11:00. Plot is centered on the geomagnetic pole and circles are drawn every 10° down to 50° MLat.

![]()
Citation: Lukianova Renata , Alexander Kozlovsky (2020), Electron density in the polar F region ionosphere during solar minimum: modeling, radar and ionosonde observations, Russ. J. Earth Sci., 20, ES1004, doi:10.2205/2019ES000699.
Copyright 2020 by the Geophysical Center RAS.
Generated from LaTeX source by ELXfinal, v.2.0 software package.